

Case study
The bus driver beats the banker. What a year of work is worth to society
We ran fifteen ordinary occupations through impactaccounting.ai and asked a narrow question — does the value a job creates for other people have anything to do with what it pays? Almost nothing, it turns out.
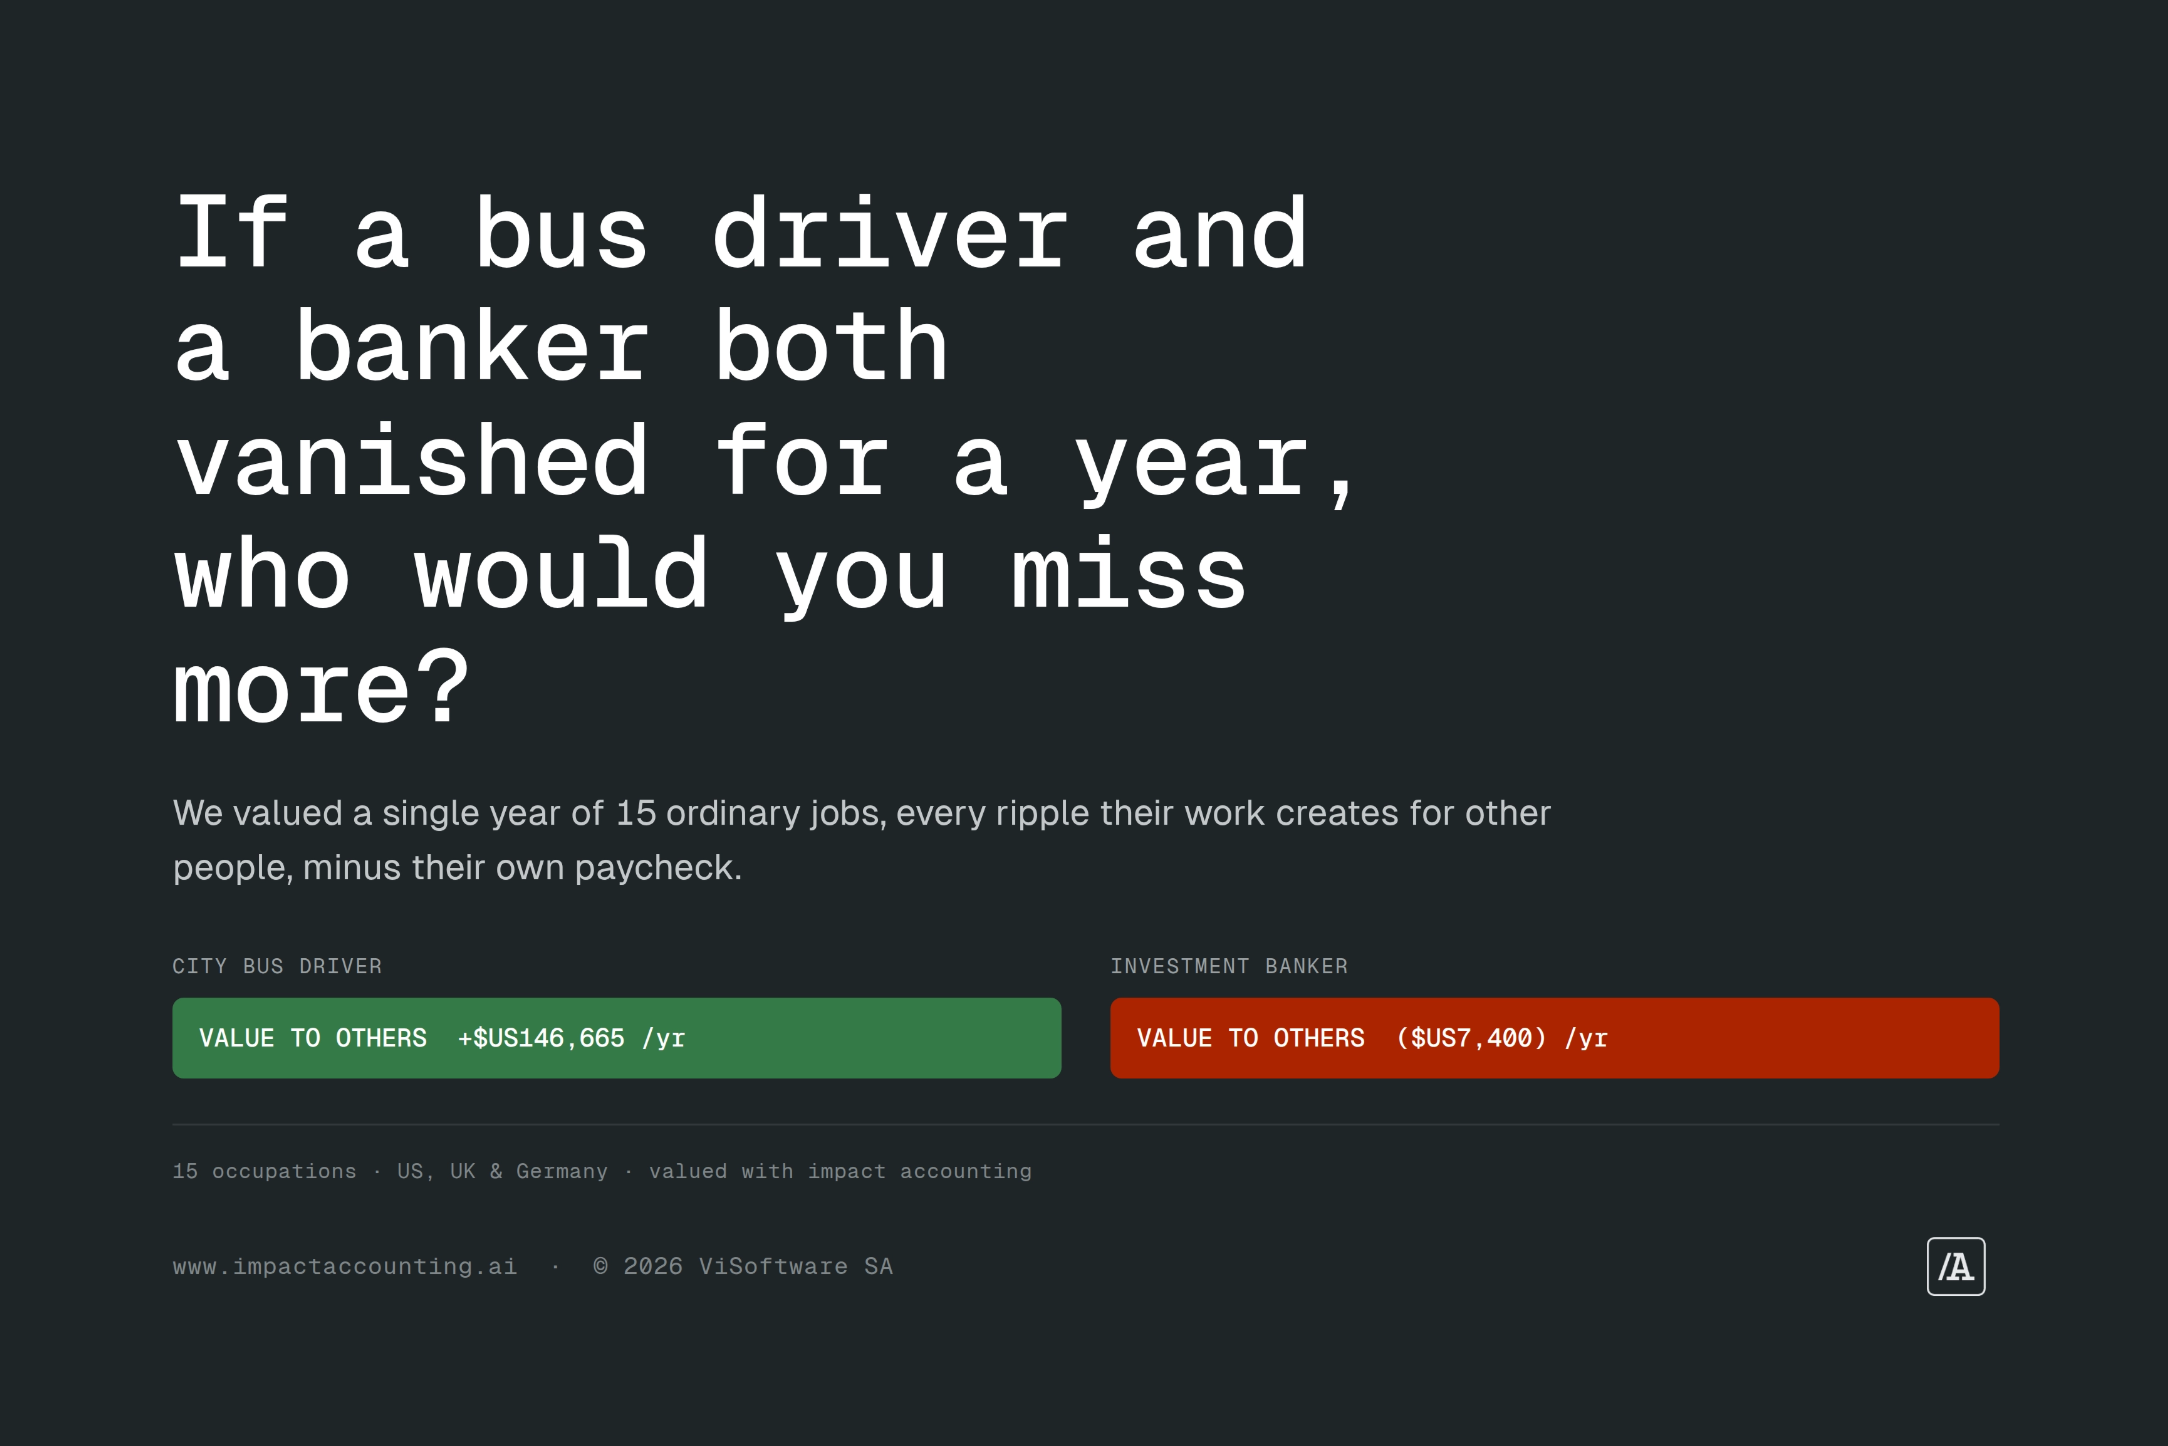
If a bus driver and a banker both vanished for a year, who would you miss more?
It sounds like an argument you would have in a pub, and for most of economic history that is where it stayed. The economist's instinct is that the market has already settled it. Whoever is paid more is worth more, because that is roughly what "worth" means in a market. The other instinct, the one that creeps up on you while you sit behind a bus you have suddenly started to appreciate, says the market might have it backwards.
In 2018 the anthropologist David Graeber wrote a whole book on the second instinct. He called a good deal of well-paid work "bullshit jobs" and argued that the jobs we can least afford to lose are often the ones we pay the least. It was a provocative claim, a political one, and, conveniently for everyone involved, an untested one.
So we tested a version of it. Graeber judged jobs largely by how the people doing them described their own work. We ran fifteen ordinary occupations through impactaccounting.ai and asked something narrower, the kind of question that can carry a number. Does the value a job creates for other people, over and above the pay its own worker takes home, have anything to do with how much that worker is paid?
How we measured it
Picture each job as a stone dropped in a pond, and follow the ripples. The patient who lives because a nurse caught the warning sign. The child who reads because a teacher taught her, and earns more for the next forty years. The gambler who loses the rent because an app was engineered to keep him playing. Good ripples and bad ripples, each converted into the same unit and then into money, so a prevented death and a tonne of pollution can sit in the same column. This is impact accounting applied to a single worker-year instead of a whole firm.
Two rules kept the exercise honest. First, we only counted ripples that would not have happened anyway. If the crop gets grown regardless, the farm worker is credited with the difference one more worker makes, not with feeding the nation. Second, we removed each worker's own paycheck, because a salary is value the worker keeps. What remains is what the job does for everyone else.
Hold onto that second rule. It does most of the work in what follows.
All fifteen jobs were valued in the United States, the United Kingdom and Germany, weighted equally. That choice matters, and we come back to it. All figures are in US dollars.
The map
Every job is a dot. Pay runs left to right, value to others runs bottom to top. If pay bought value, the dots would march up a neat diagonal, from cheap-and-pointless in one corner to expensive-and-priceless in the other.
They don't.
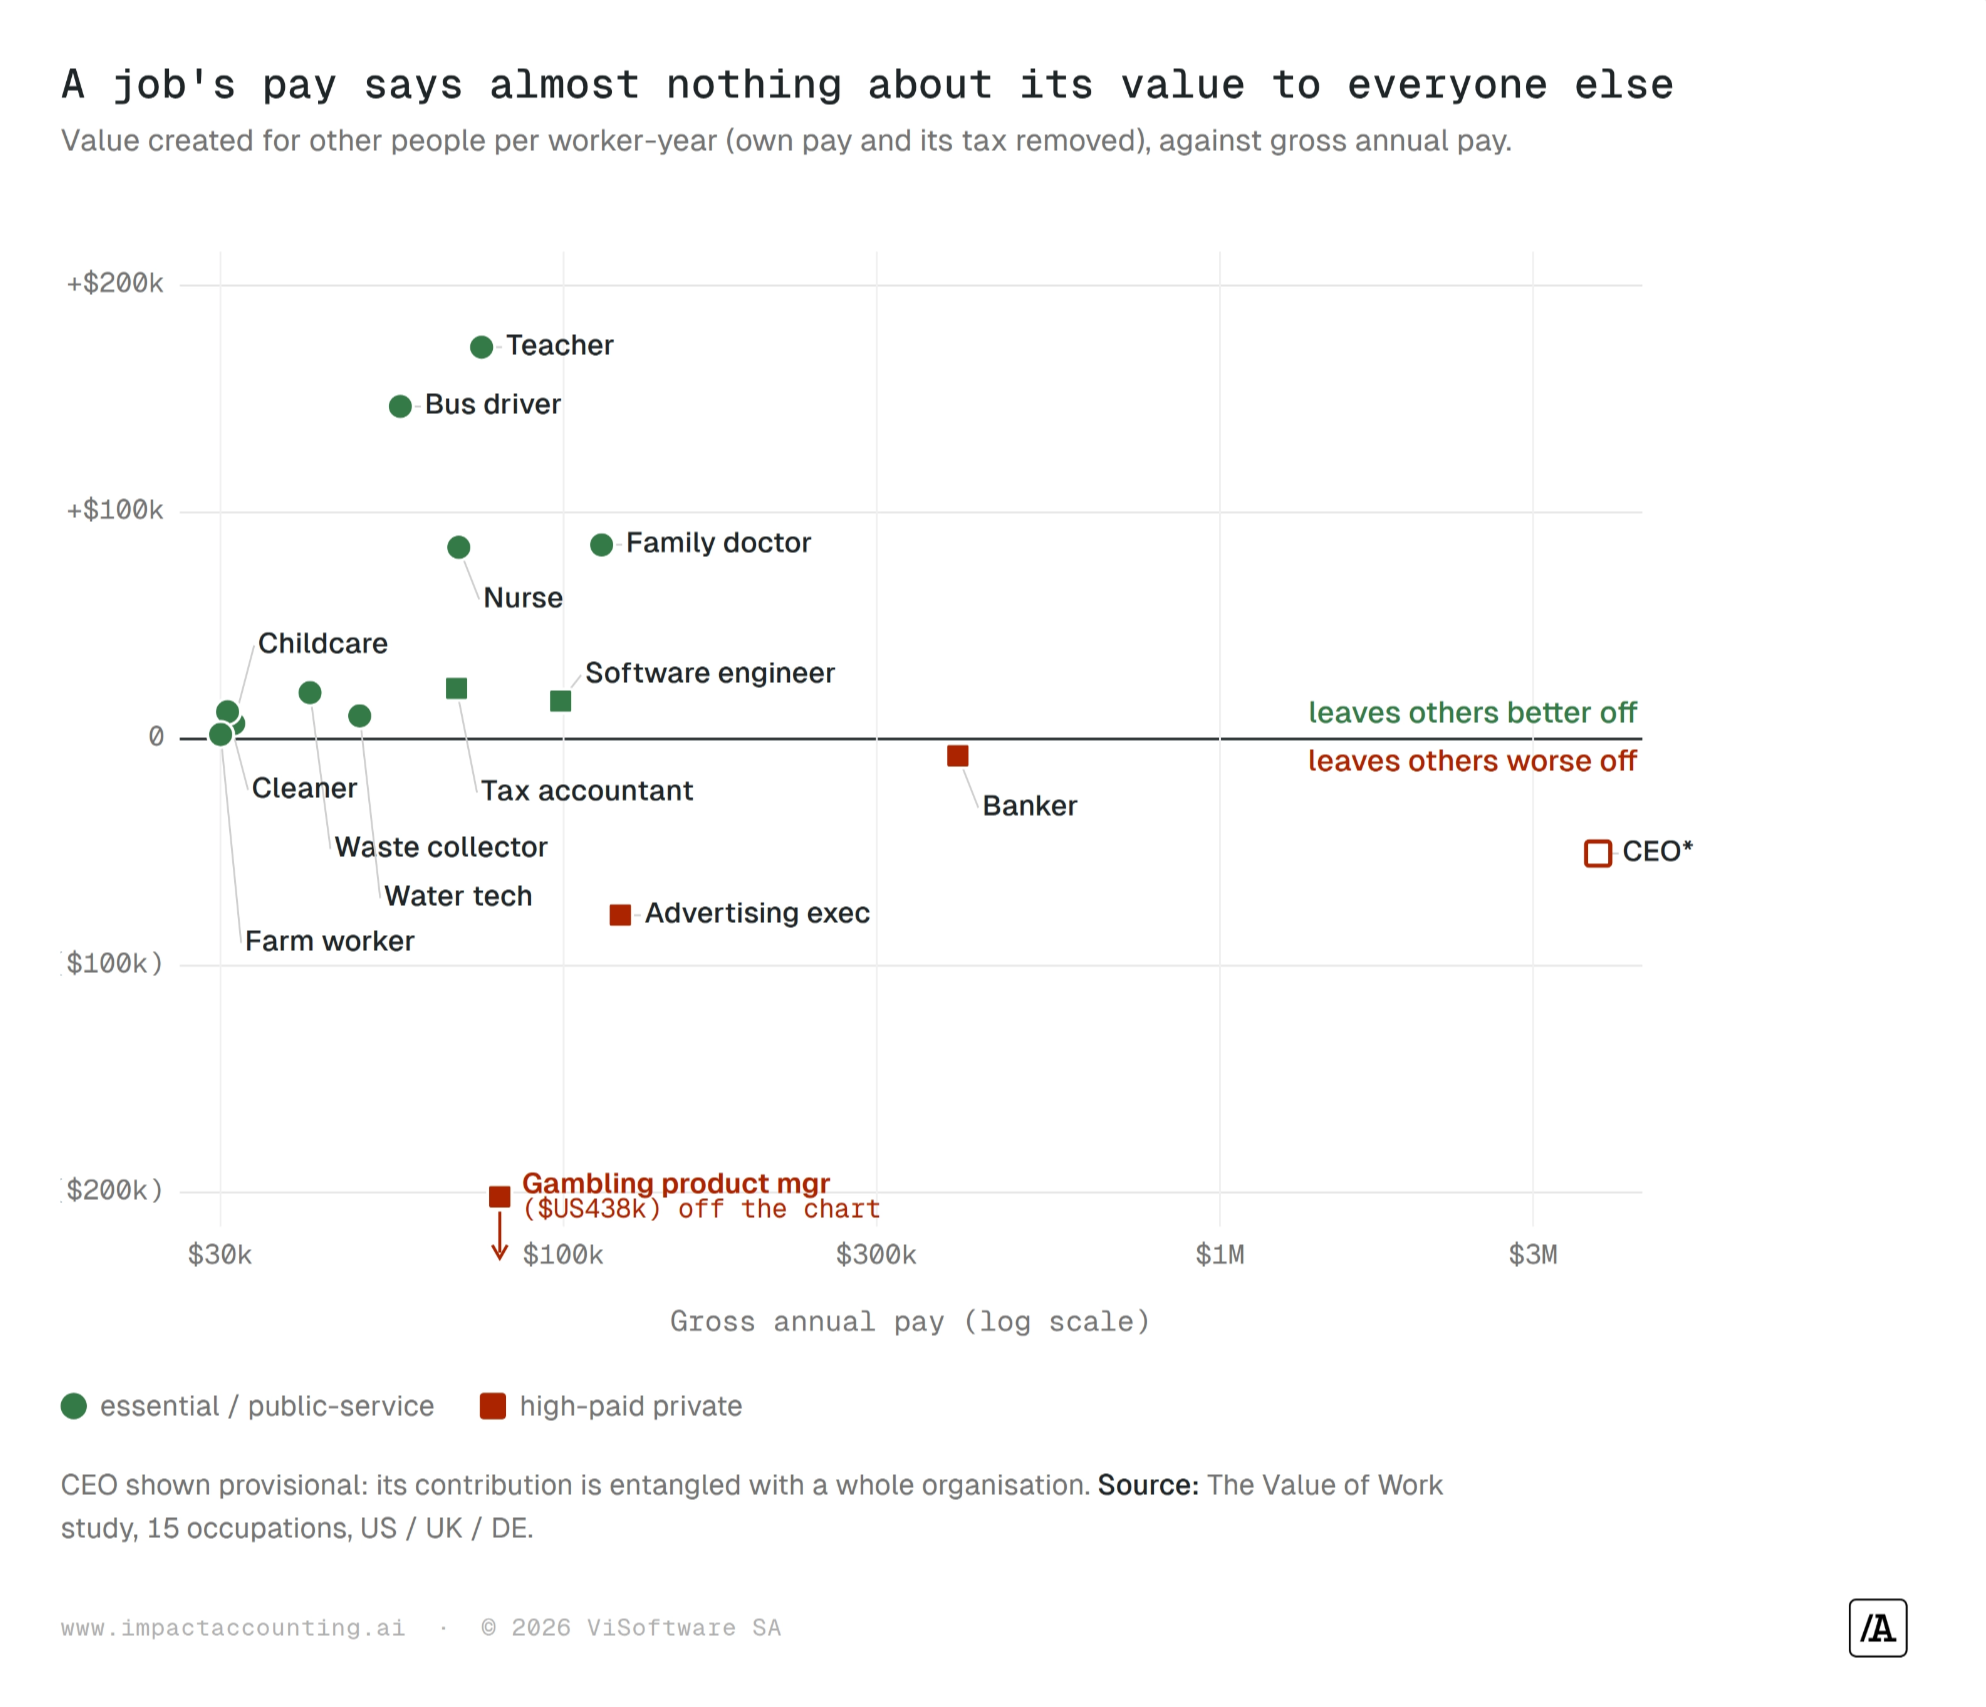
The dots highest up are a teacher, a bus driver, a nurse and a family doctor, and every one of them is paid mid-pack or below. A year of primary teaching creates around $172,773 of value for other people. A year of bus driving, $146,665. The two best-paid people in the study sit far to the right and below zero. The banker's year comes out at −$7,400 for everyone else once own pay is stripped, close enough to zero that we would not read anything into the minus sign. The chief executive lands near −$50,540, a figure we already flag as provisional for reasons that deserve their own section. The two jobs that are genuinely, unambiguously negative are the advertising executive and the online gambling manager, and they are negative by margins far outside any rounding.
Both sit below the line by design rather than by accident. The most stark is the gambling product manager, whose year of work removes about $438,279 of wellbeing from other people, most of it through the harm concentrated in problem gamblers.
The service-charge trick
Here is where the second rule matters. There is one move that makes high earners look socially useful, and it is adding back the income tax on their large salaries. Do that, and pay and value appear weakly related, with a correlation of +0.43. It looks, for a moment, like the market knew what it was doing.
However, that tax is not something their work produced for others. It is a slice of their own paycheck, handed to the government on the way past. Counting it as their gift to society is like congratulating someone for the service charge the restaurant added to their bill. Remove it, which is the honest thing to do, and the relationship does not merely flatten. It turns slightly negative, at −0.22.
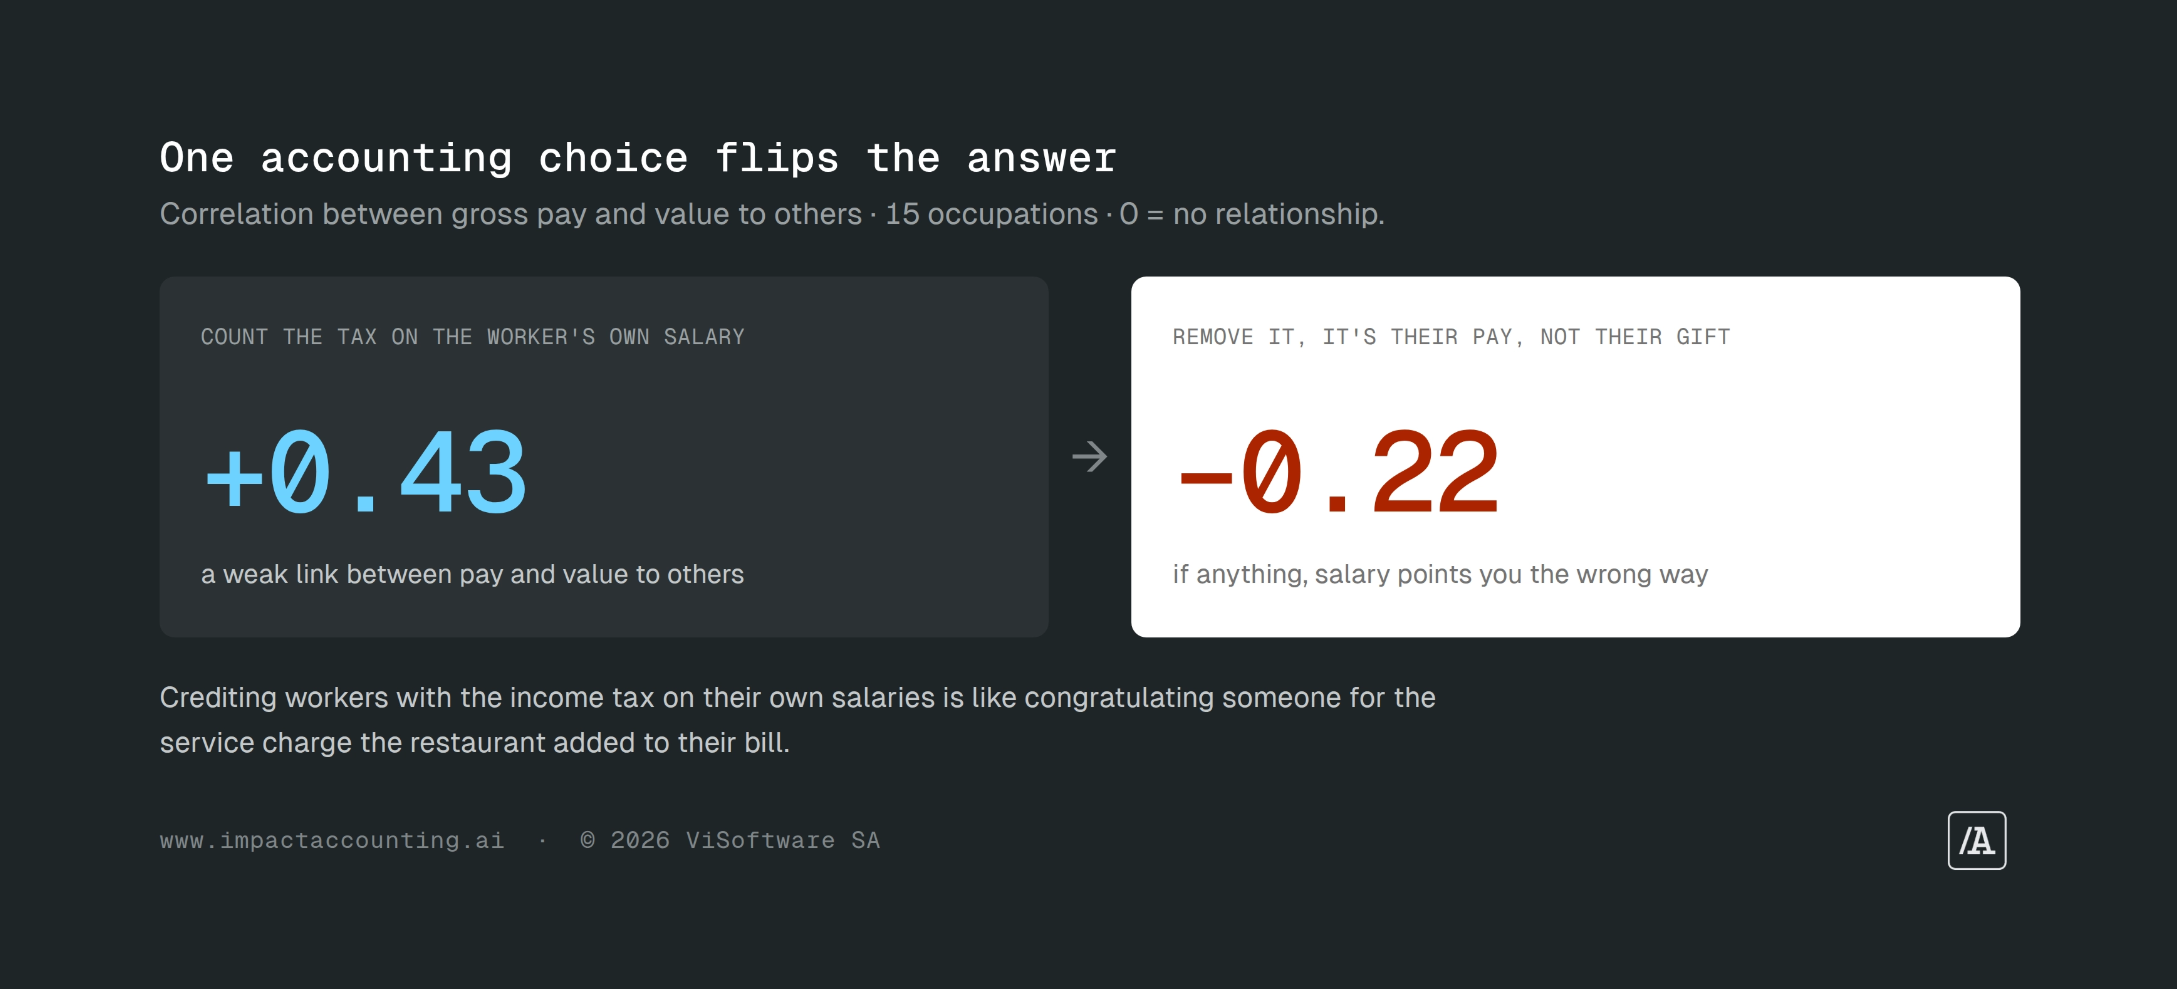
With only fifteen jobs, neither figure is strong enough to lean on. The honest reading is not that the relationship runs backwards, it is that there is almost no relationship at all: what a job pays explains next to none of the difference in what it gives back, and an accounting choice most people would never notice is enough to move even the sign.
This trick is worth remembering well beyond this study, because a version of it runs through a lot of corporate impact reporting. Whenever an impact claim is dominated by money that was merely passing through, wages received, taxes withheld, revenue collected, the right question is the one this study forces. What did the work itself change for other people?
Value for money
If the map feels abstract, here is the same fact with a price tag. For every dollar paid to a bus driver, other people receive about $2.60 of value. A teacher returns $2.30, a nurse $1.22, a family doctor $0.75. The banker and the chief executive return close to nothing per dollar, and on these figures slightly less. Four of the fifteen jobs return a negative value per dollar of pay, and the lowest of them stands at −$5.48.
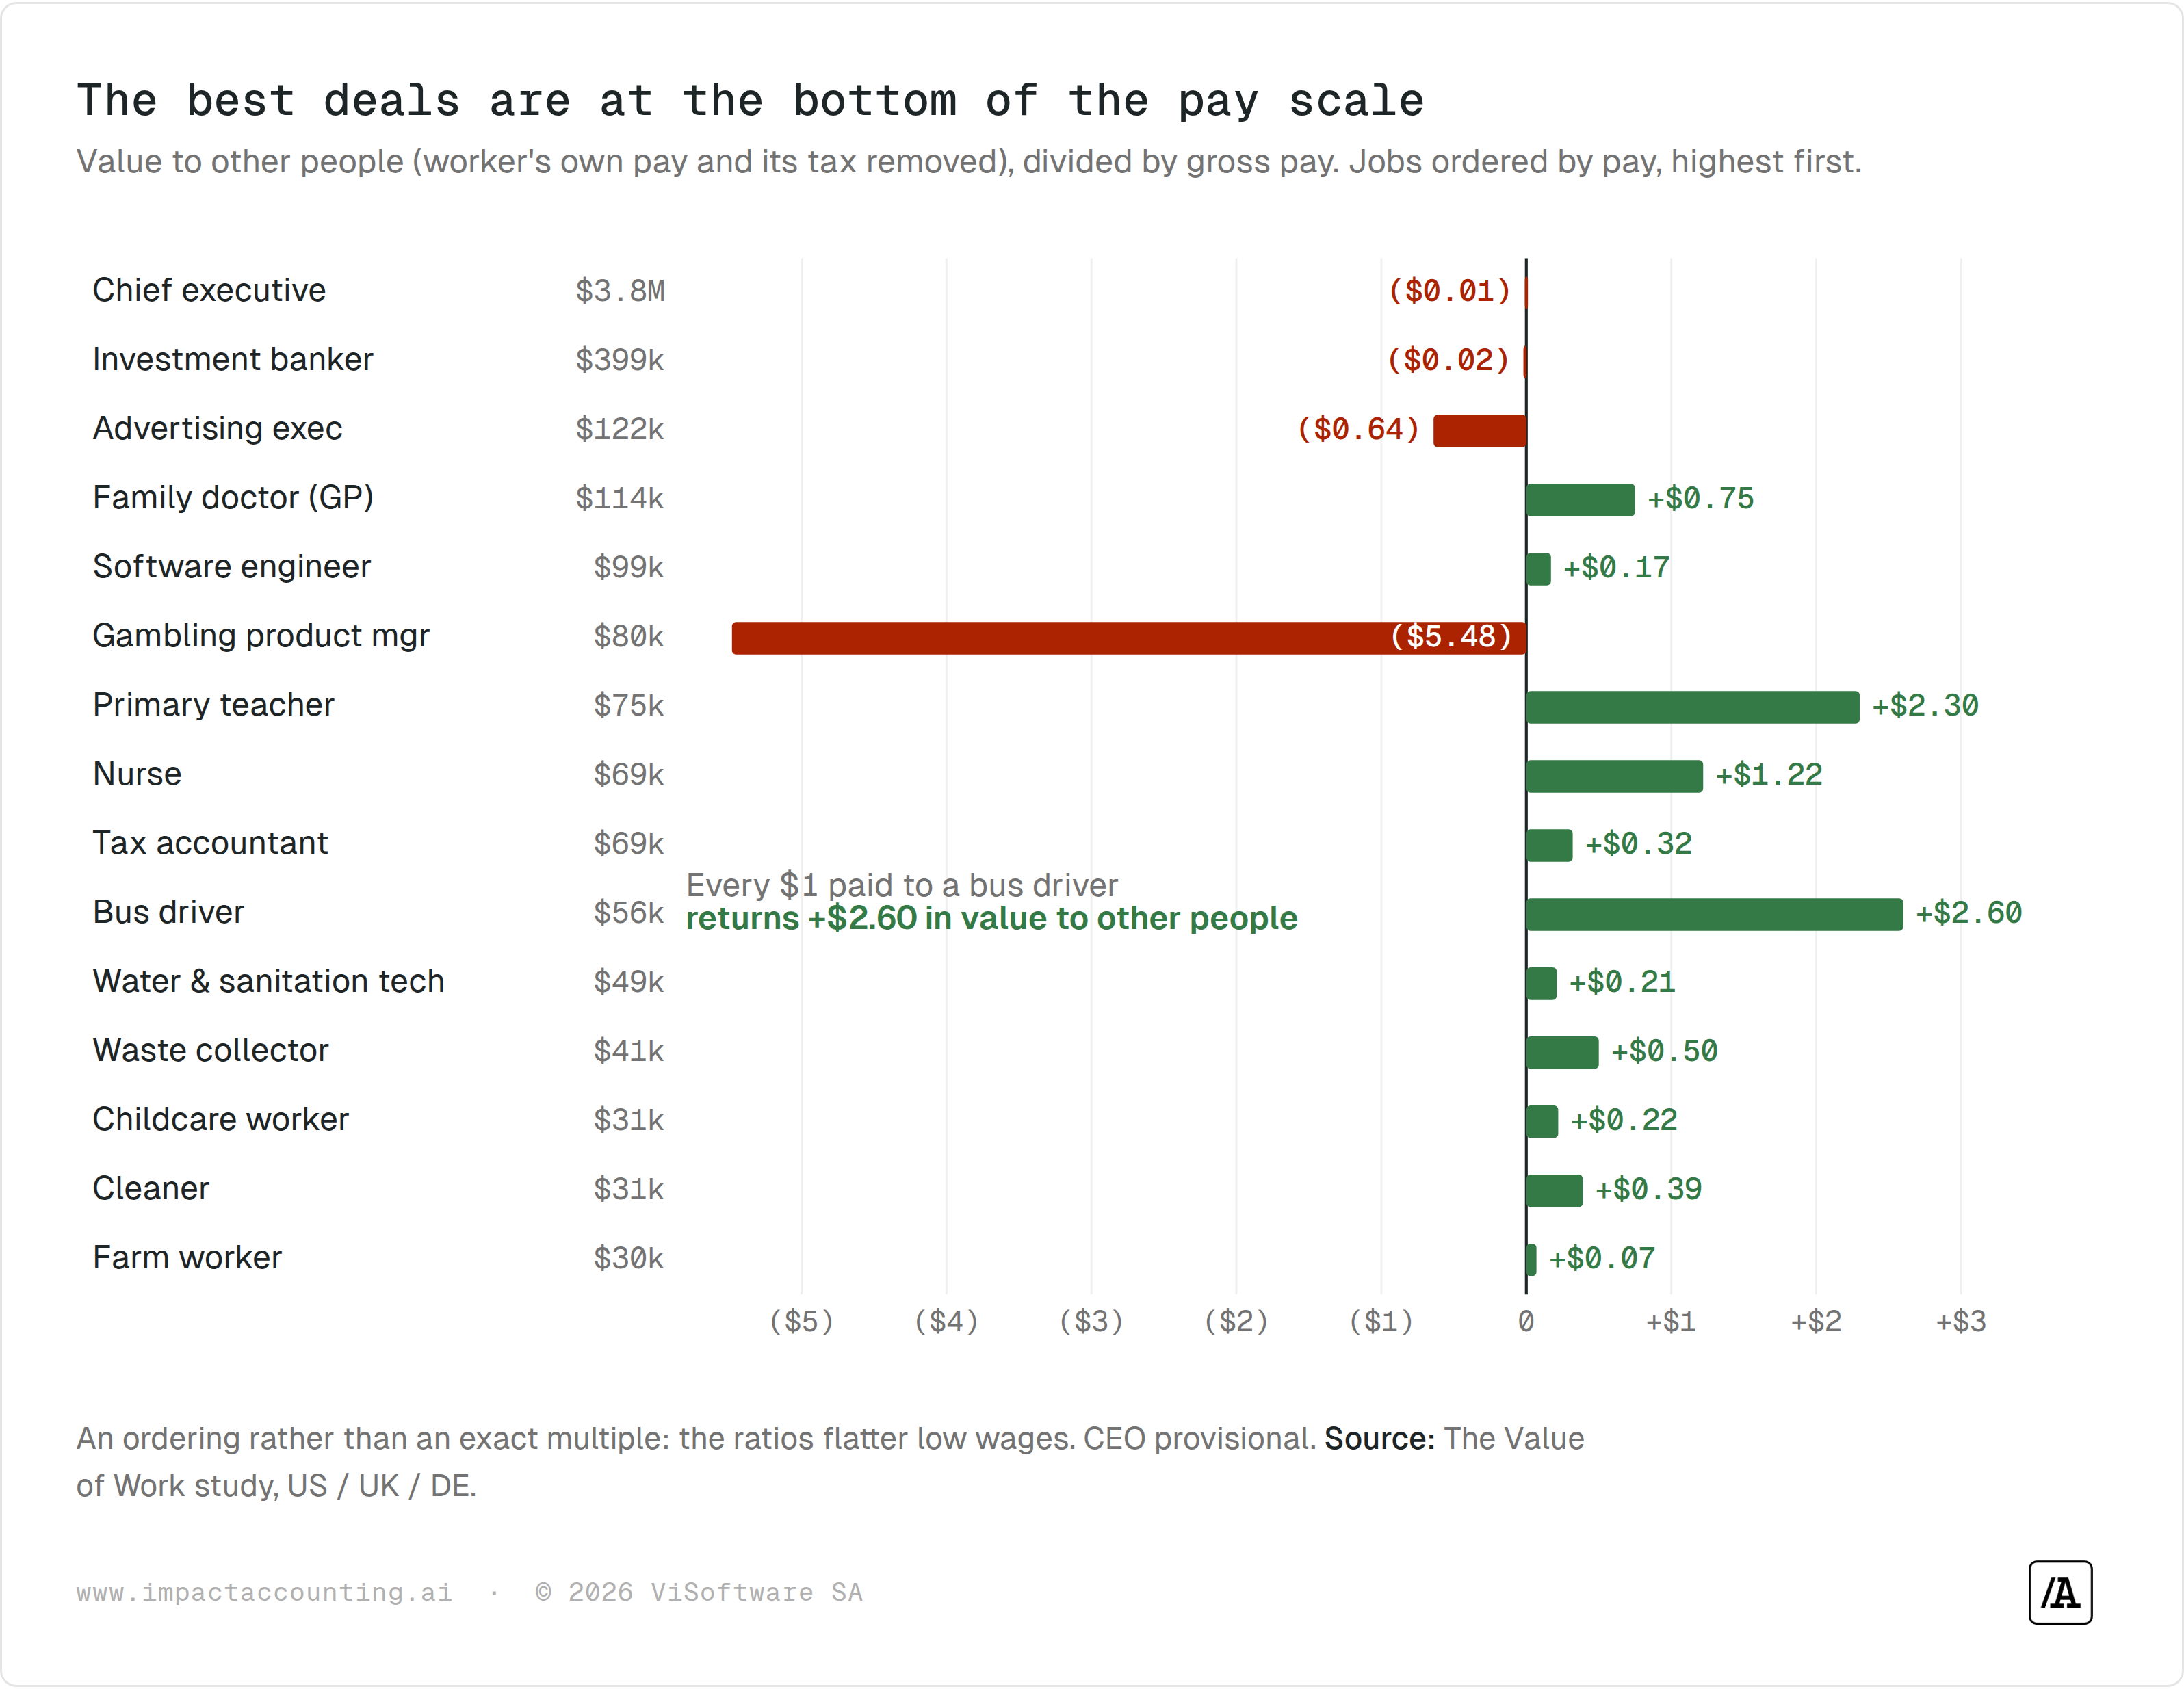
Notice which end of the pay scale the bargains sit on. These ratios are generous to low wages, since dividing real value by a small salary flatters the result, so read the chart as an ordering rather than an exact multiple. The ordering, though, is not subtle.
The anatomy
A reasonable reader suspects a trick, so here is every job broken down in full. We sorted each job's ripples into categories and split them into two piles: money linked to the worker's own pay, and value landing on other people.
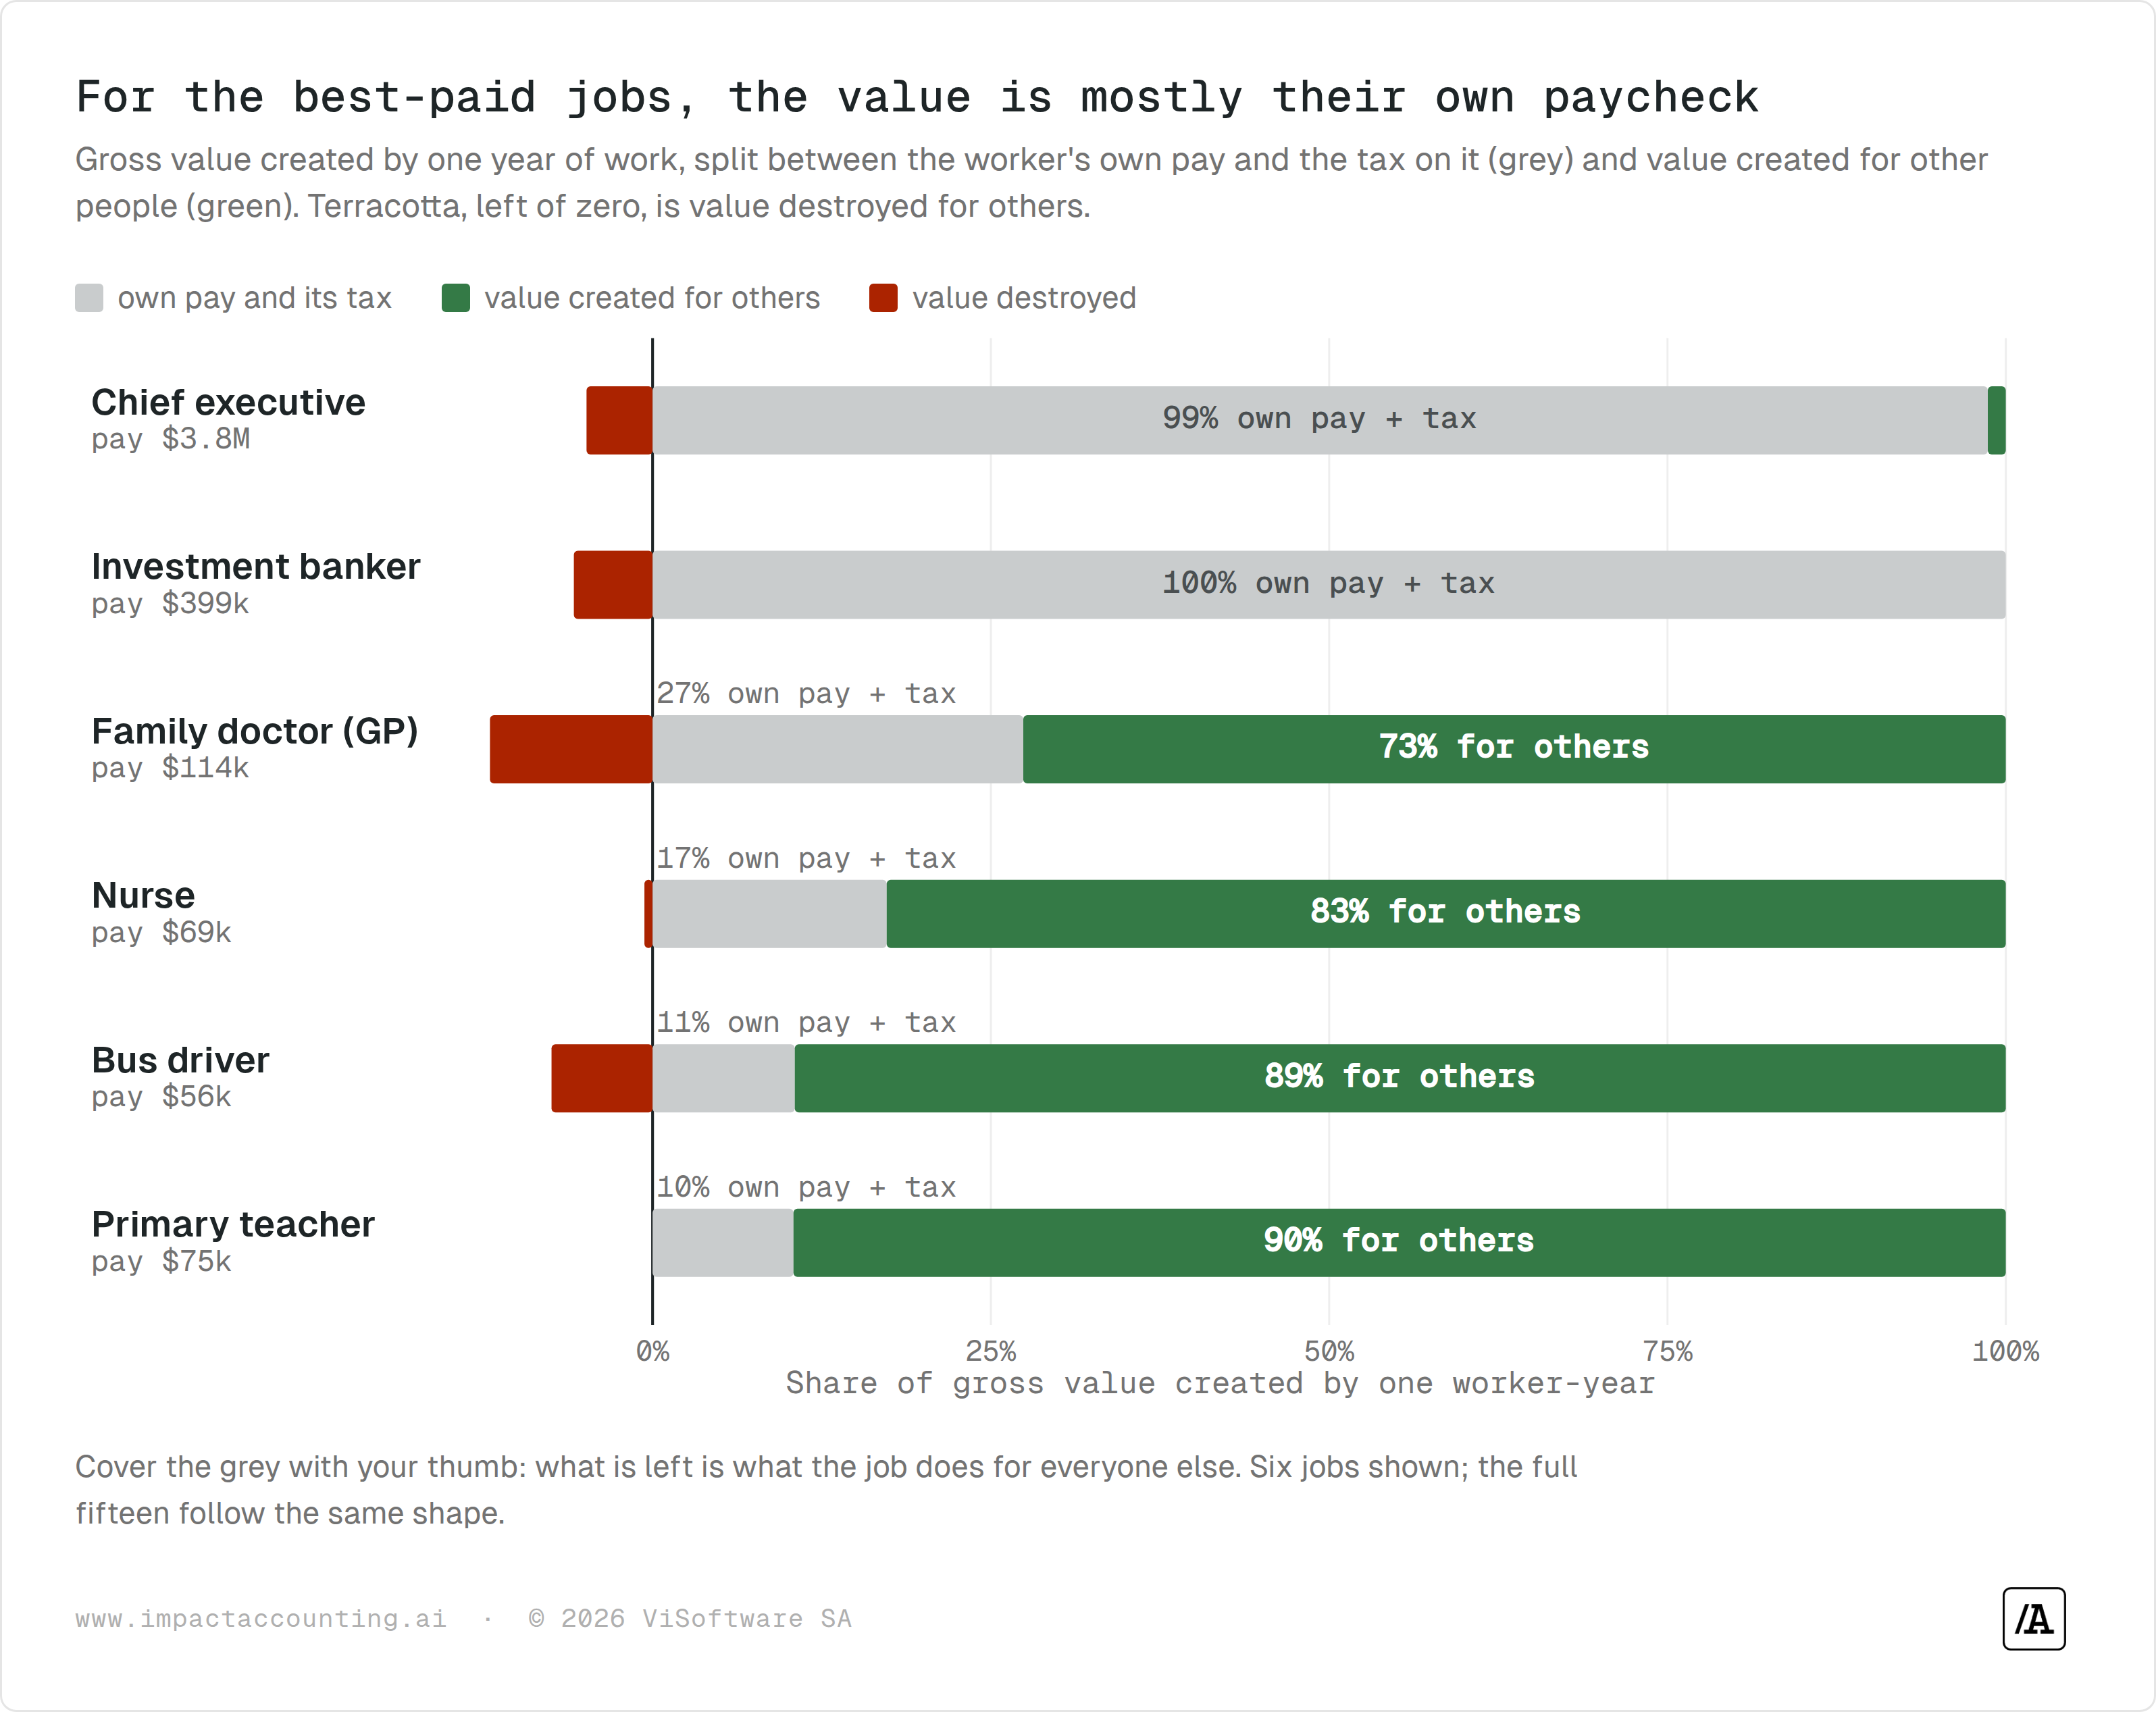
For the chief executive and the banker, the worker's own pay and the tax on it make up essentially the entire positive block, 99 and 100 percent respectively. Set the grey block aside and there is almost nothing left. For the teacher, the nurse and the bus driver the picture inverts. Around nine tenths of the value they create lands on other people, spread across learning, health, access and the environment. The teacher's largest single contribution is not even in the classroom ledger. It is the future earnings, and downstream taxes, of pupils who learned to read.
What this means
The study claims one narrow thing. Whatever decides pay in these fifteen jobs, it does not look much like measurable value to others. But a few sharper implications follow for anyone who manages, invests in, or reports on impact.
"We created 500 jobs" is the least informative sentence in impact reporting
A job is a container, and the contents vary enormously. In this study, the gap between one worker-year of bus driving and one worker-year of gambling product management is roughly $585,000 of societal value. Any impact report that counts jobs without asking which jobs is reporting the number of containers on the ship and calling it the cargo. If employment is your impact thesis, the pathway that matters is what the work does to other people, not the headcount.
The economy will pay you well to make others worse off
The gambling product manager earns a comfortable $80,000 while removing more than five dollars of wellbeing from others for every dollar earned. There is nothing irrational about this. Labour markets price what an employer will pay for output, and an employer profits handsomely from engineered losses. It simply means a salary is a measure of private willingness to pay, never a certificate of social usefulness, and any due diligence that treats headline employment as inherently positive has skipped the most interesting question.
Our biggest number is our shakiest, and we say so
The largest figure in the study belongs to the chief executive, and it is also the one we trust least. Executive contribution is real but tangled up with the work of thousands of other people, and untangling it is a judgement call. Nudge one assumption, whether the counterfactual is no chief executive or simply a different one, and the figure swings by roughly half a million dollars. So we flag it, show it both ways and refuse false precision. The same discipline has to apply where the uncertainty helps our case. Two-thirds of the teacher's figure is tax on earnings that pupils have not made yet, which rests on assumptions about future wages and discounting that are no firmer than the executive's counterfactual. It is our second shakiest number, and it happens to be the one carrying the headline. Publishing the uncertainty next to the number, in both directions, is what separates impact accounting from impact marketing.
Geography would redraw the whole map
These are rich-country numbers, and that deliberately shrinks the value of essential work. A water and sanitation technician prevents modest harm where clean water can be taken for granted, and prevents catastrophe where it cannot. Run the same study in a lower-income setting and the essential corner would climb far higher. For global companies and investors, the same job in the same company can carry a very different societal value depending on where it is done, which is precisely why serious impact accounts are location-specific.
A gap is not an explanation
We can show that pay and contribution have drifted apart. We cannot tell you why, and anyone who claims the number settles that argument is overstating what a number can do.
Four traditions read the gap differently, and they disagree with each other. The first three offer competing explanations; the fourth is not an explanation at all, but a warning about the act of measuring in the first place.
| Tradition | How it reads the gap |
|---|---|
| Feminist economics · Marilyn Waring, Nancy Folbre | The tools we use to measure the economy were built around paid market work and left unpaid care outside the frame from the start. Jobs like nursing and teaching are therefore not mispriced by accident, but because of a blind spot the system was never designed to correct. |
| Labour economics · Ha-Joon Chang, Elizabeth Anderson | Two equally skilled workers can be paid very differently depending on union strength, how easily they can be replaced, and who is allowed into the profession. The gap becomes a story about leverage over the split of value, rather than the size of it. |
| Value creation vs. capture · Mariana Mazzucato | Mazzucato draws a sharper line between creating value and capturing it, reading some highly paid roles, particularly in finance, as rewarded for steering or extracting existing flows of money rather than adding to them. |
| The sceptical view · Michel Foucault, Richard Sennett | Reducing a person's work to a single number is never neutral and has long been used to sort and discipline people. This is part of why we publish a map and refuse to turn it into a league table. |
The fine print
Every measurement is a stack of choices, and ours tilt the picture in ways worth stating. The geography is high-income by design. The chief executive is provisional and reported both ways. Additionality on wage and tax pathways is held at 40 percent and flexed between 30 and 50 to see how far the results move. And the value that resists counting, coordination, craft, the care that never becomes a statistic, carries the most uncertainty, which is why we stress-test it rather than quietly drop it.
One caveat outranks the rest. This study measures what a job gives to other people. It does not measure what the worker should be paid, and it is not an argument for raising or cutting anyone's wage. Those are moral and political questions, and a number cannot settle them. All the study shows is that what a job pays and what it gives back have come apart, which is a fact about how the labour market works, not a demand made of it.
Worth to whom?
If the bus driver and the banker both disappeared for a year, the numbers say you would miss the bus driver more, and it is not close. A large salary reads to most of us as society's way of saying "this matters." For most of these fifteen jobs, the price of the work and the good it does for everyone else turn out to be nearly unrelated. The payslip is telling us something. It is just not telling us what we assumed.
So the next time someone says they are paid what they are worth, there is one question worth carrying into the claim, whether it is about a person, a job, or a company's headline impact.
Worth to whom?
This study valued fifteen single jobs. The same accounting runs on whole organizations, funds and portfolios, with every assumption inspectable and every figure traceable to its source. Test it on a name you know at impactaccounting.ai, or write to Samuel at sv@impactaccounting.ai. Full method and per-job workings available on request.
Appendix · Jobs deep-dive
Each of these adds a layer the headline charts cannot: where a big number actually comes from, and why the market cannot see it. Every figure is drawn straight from the study's pathway ledger.
The farmer
A number this small is a verdict on the counterfactual, not on farming.
Nothing is more essential than food, so the farm worker's $1,953 of value to others, the lowest of any essential job, looks like the model getting it wrong. It is not. Two rules explain the figure. The first is additionality: we credit only the difference one more worker makes, never the harvest itself. In a mechanised, well-supplied rich-country food system, the marginal worker adds little the system would not otherwise produce, so the enormous value of a population being fed sits in the baseline, uncredited, exactly as it does for every job.
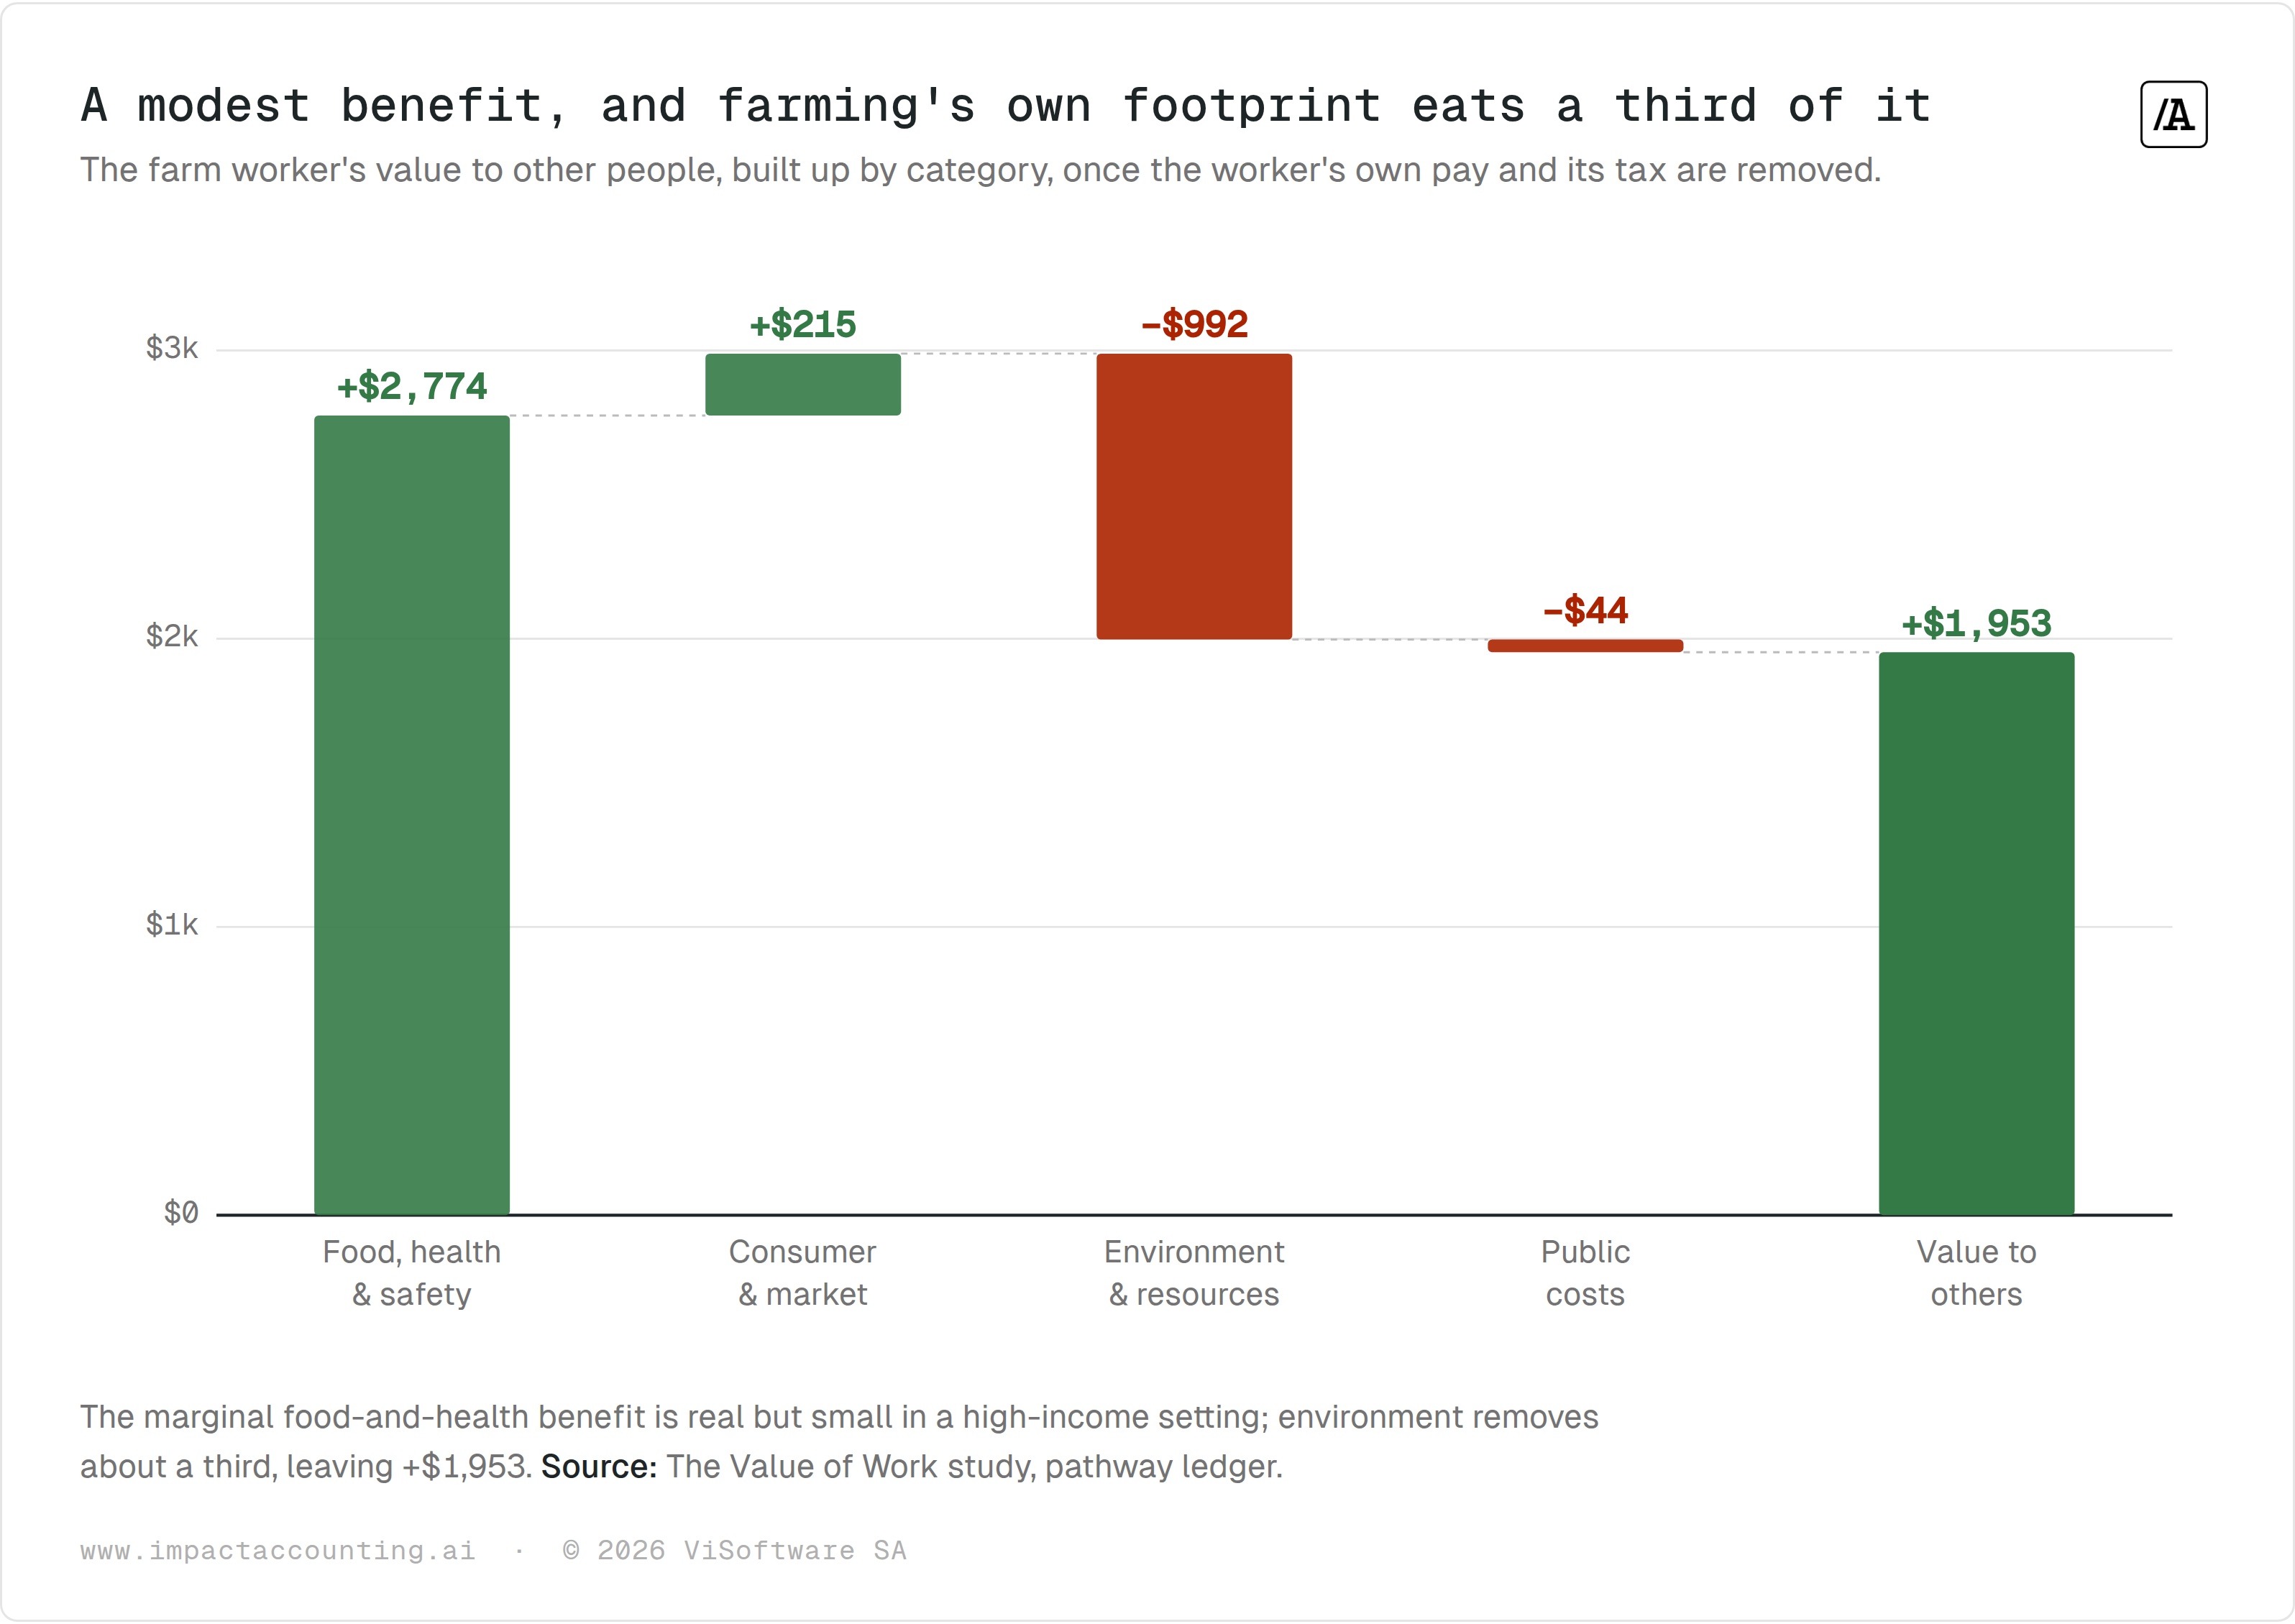
Count only the margin and what is left is a modest food-and-health benefit of about $2,774, concentrated in nutrition access at the edges of the market. Farming's own footprint then claws back roughly a third of it: land and habitat pressure, freshwater withdrawal and input pollution together remove about $992. The same marginal rule is applied to every job in the study, teacher and nurse included. The farm worker lands low not because the rule is stricter here, but because an extra pair of hands in a mechanised, well-supplied food system changes output very little, and what it does add is partly cancelled by the environmental cost of adding it. Geography is the second lever. Measure the same job where food supply cannot be taken for granted and the nutrition pathway would be several times larger. The low figure is a statement about the counterfactual and the country, not a ranking of how much food matters.
+$1,953 is the value to others once we count only the marginal worker, not the harvest. It is small because of where and on top of what it was measured, not because farming does not matter.
The chief executive
The largest number in the study is almost entirely the CEO's own pay and the tax on it.
On the raw ledger the chief executive posts the largest societal value in the study, roughly $1.35M for a single year. Almost none of it is value to anyone else. The worker's own wage accounts for $185,167, and the tax on that wage for $1,218,781. Together that is $1.40M, more than the entire headline. Everything the role does for people outside the pay packet, preserving some jobs, suppressing some wages, passing costs to customers and suppliers, nets to about −$50,540.
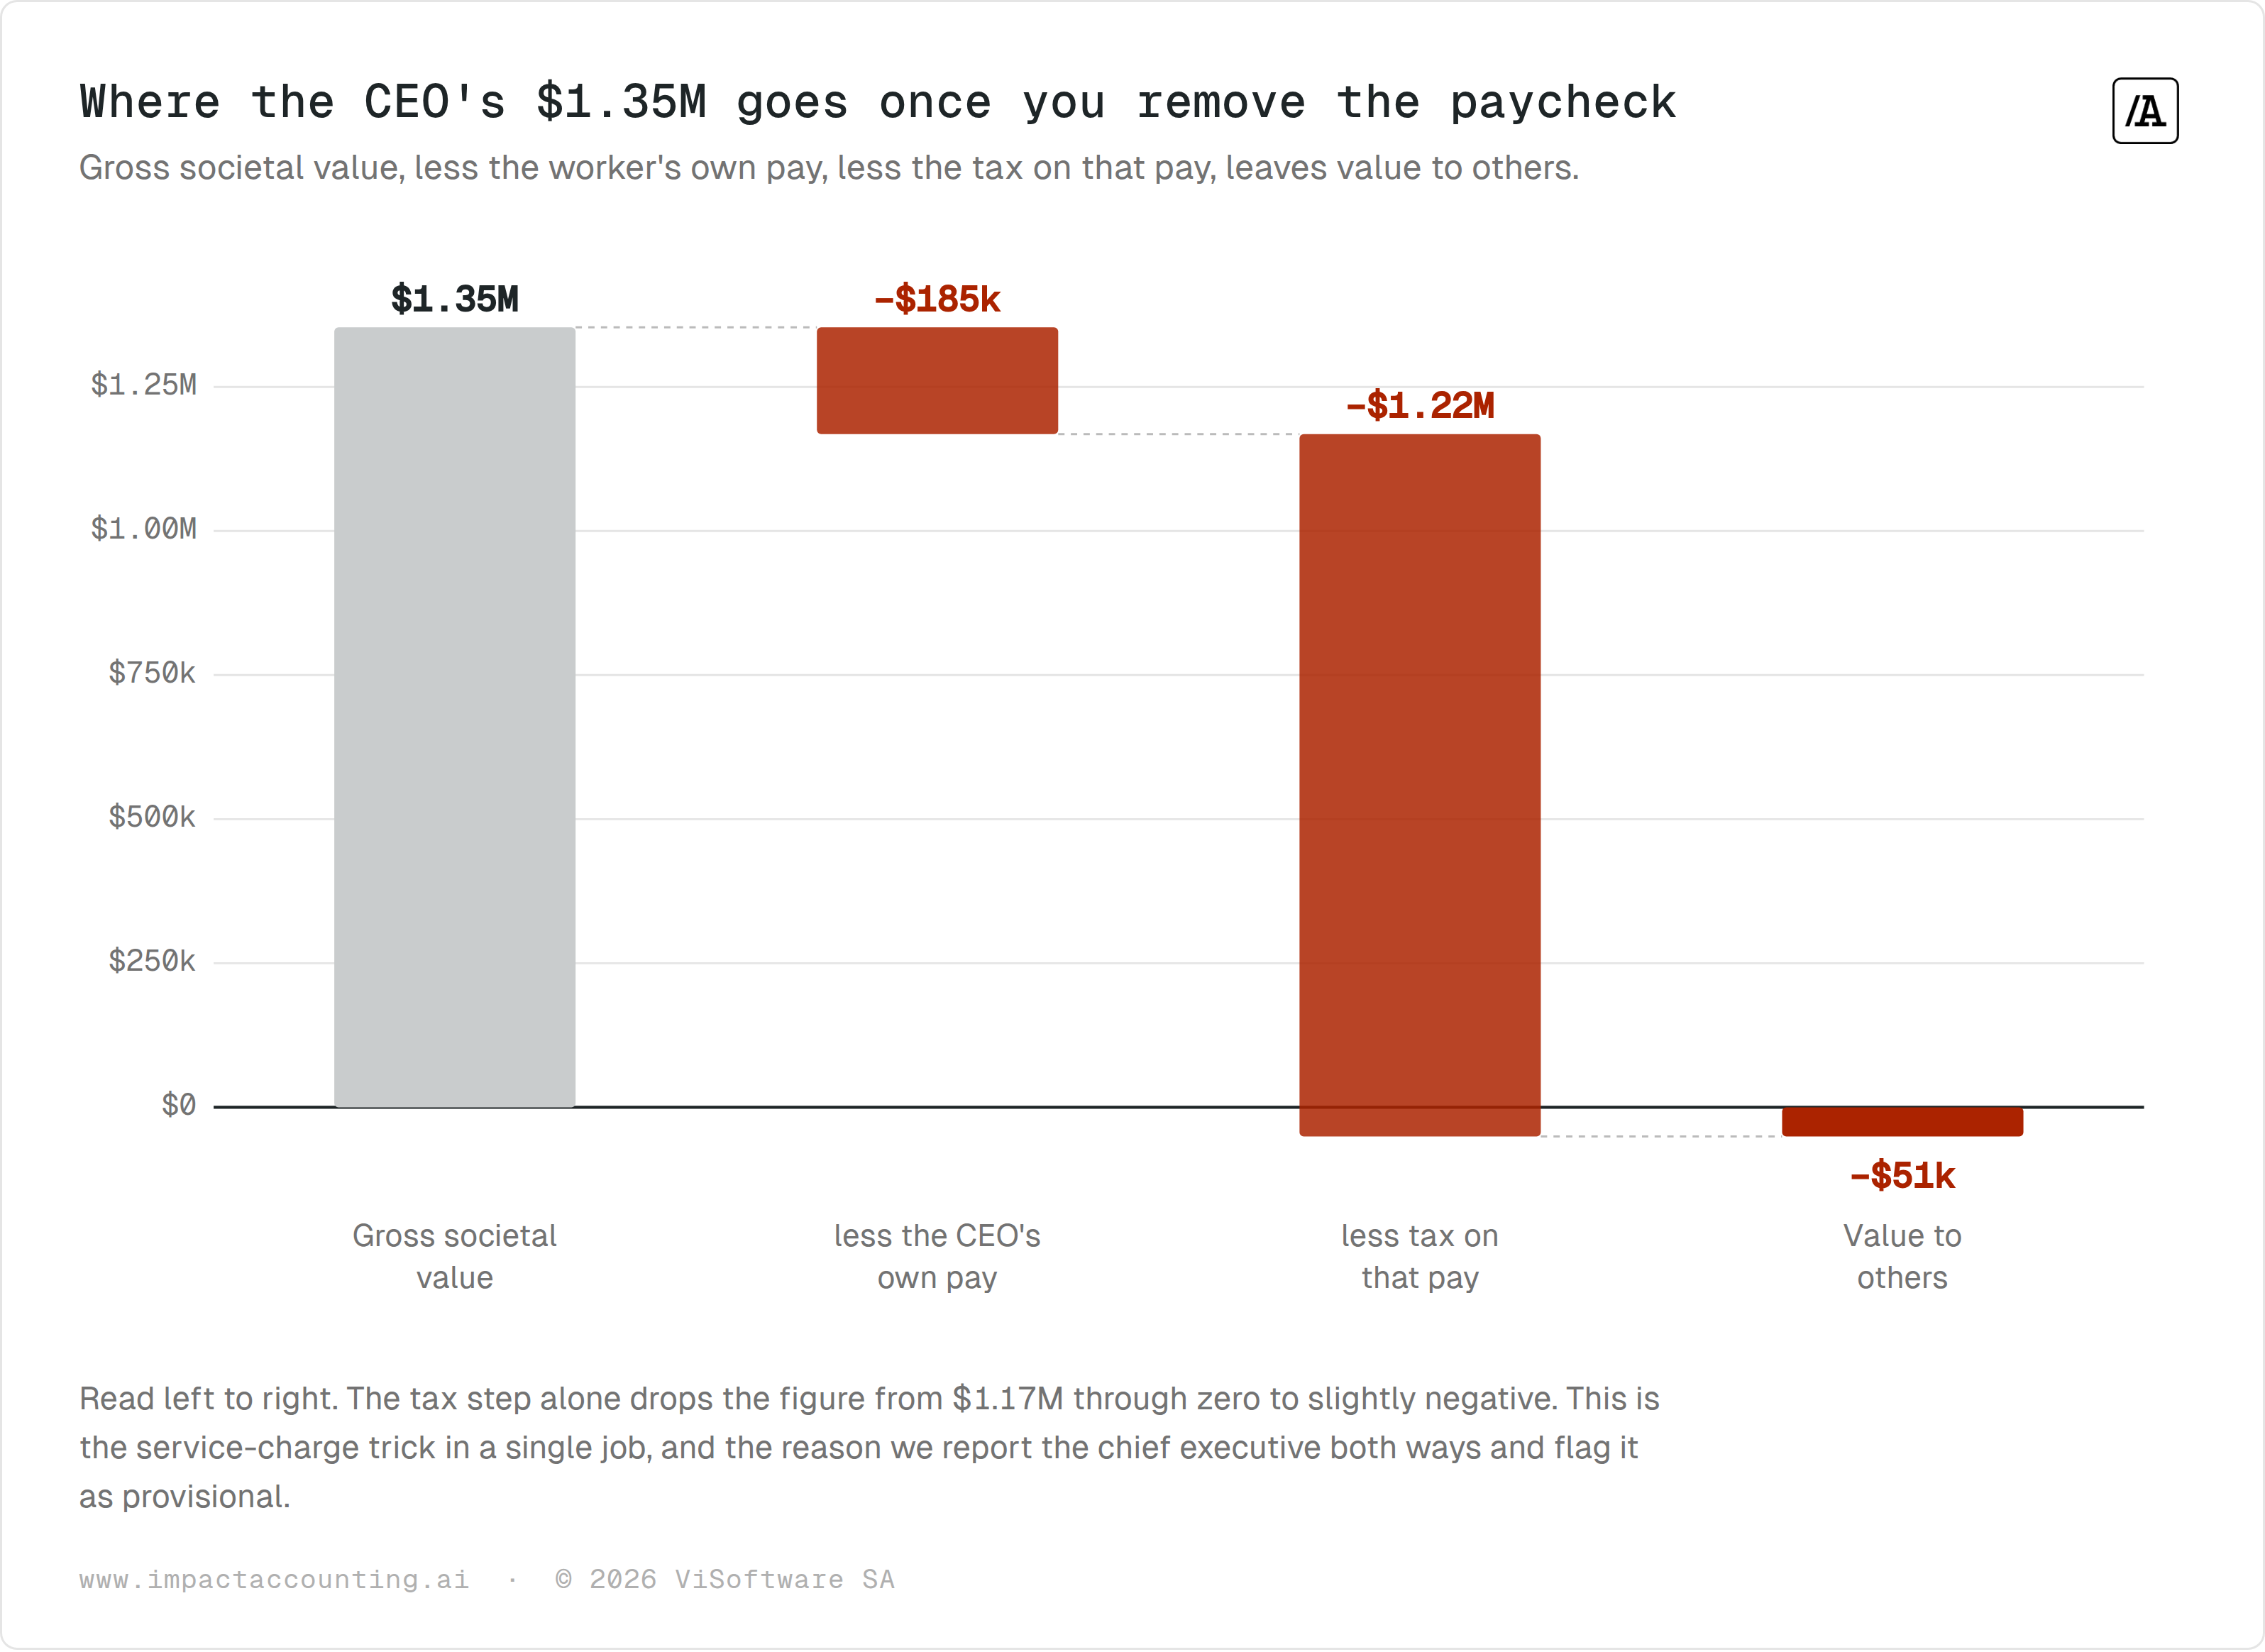
$1.40M of the $1.35M headline is the CEO's own wage and the tax on it. Strip both and the year of work leaves everyone else slightly worse off.
The gambling product manager
Strip out the tax on the harm, and gambling comes down to one pathway.
On the raw ledger the gambling product manager looks positive, about +$451,050 for the year. The reason is a single line: $862,260 of gambling duty and tax the state collects. The study excludes it, because a tax on harm is the state recycling the damage into revenue, not the work creating value.
Remove the duty and the worker's own pay, and the year lands at −$438,279. What remains is not spread thinly across millions of harmless bets. One pathway, people developing or deepening a gambling disorder, accounts for −$395,982, roughly nine tenths of the net harm, and it is a health harm.
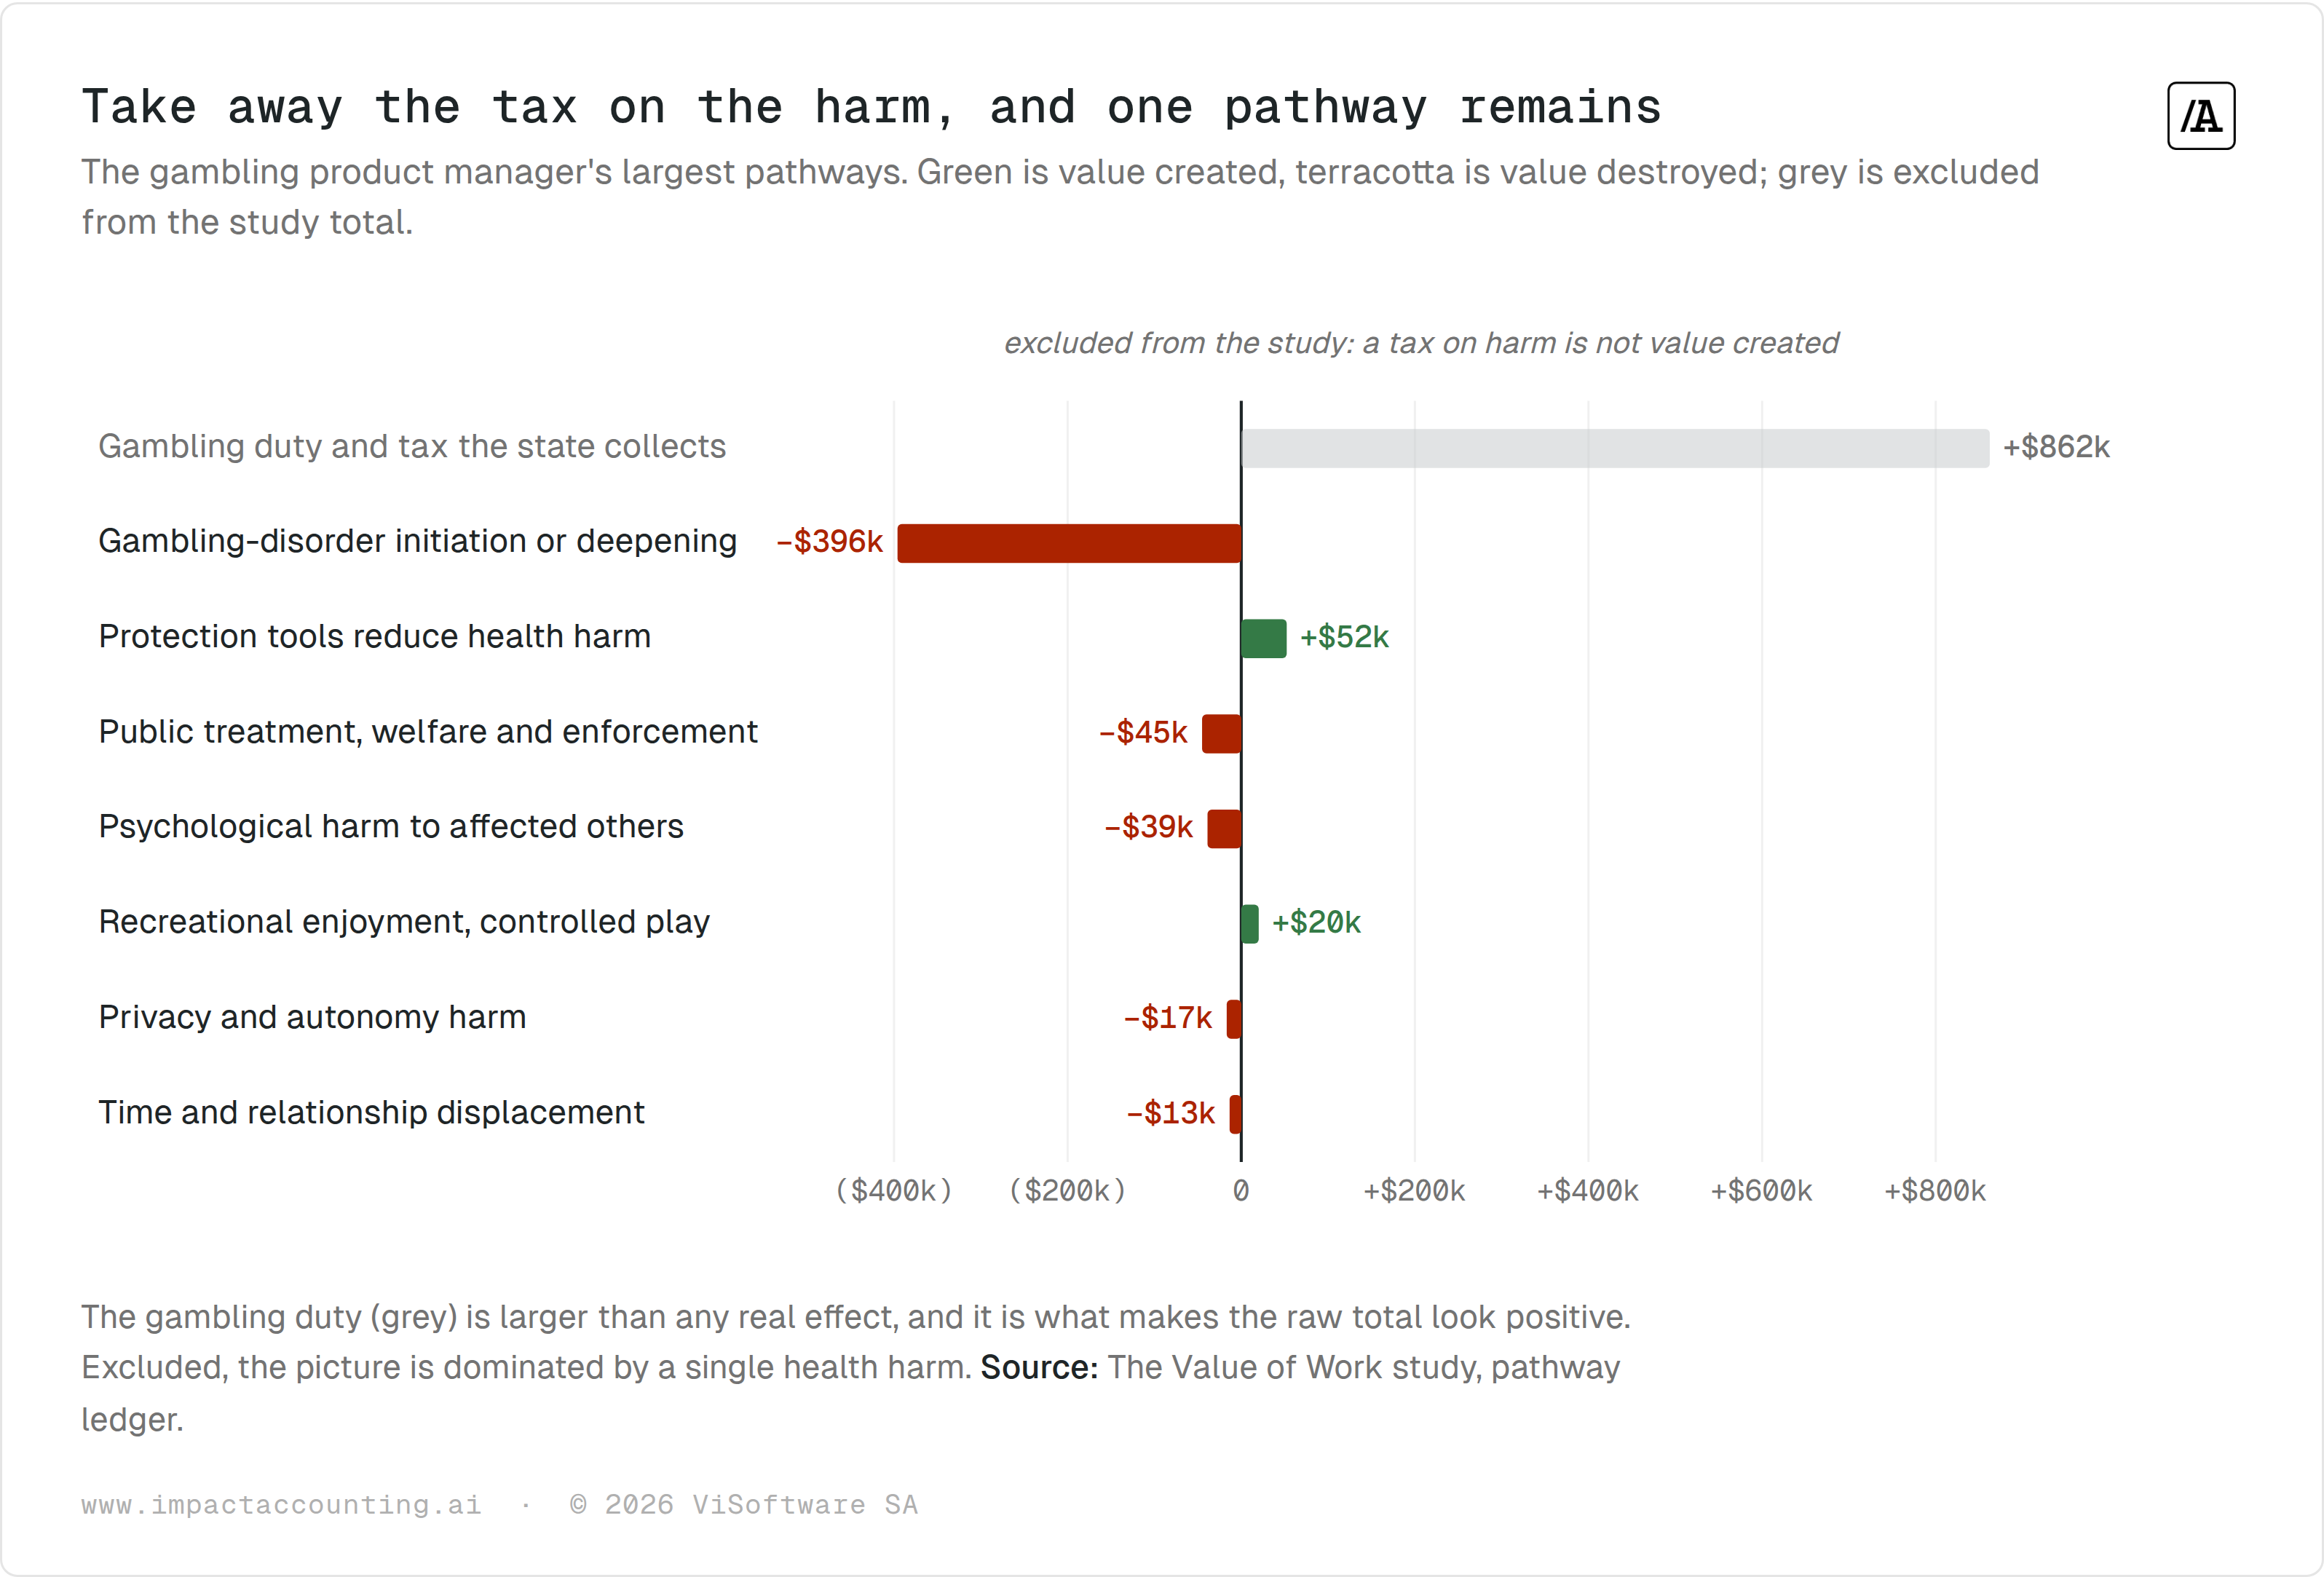
−$438,279 is what the year leaves behind once the gambling duty and the worker's own pay are removed. Nine tenths of it comes from a single pathway: people developing or deepening a gambling disorder.
The childcare worker
Our own numbers value the childcare worker for the parent, not the child.
The childcare worker creates about $6,832 of value for other people, and almost all of it flows through the parent rather than the child. Enabling a parent to return to paid work, and the tax on the earnings that follow, accounts for roughly $6,285. Relief to the parent adds another $658. Everything that lands directly on the child, safety, near-term development and future prospects, comes to about $381, under six percent of the total.
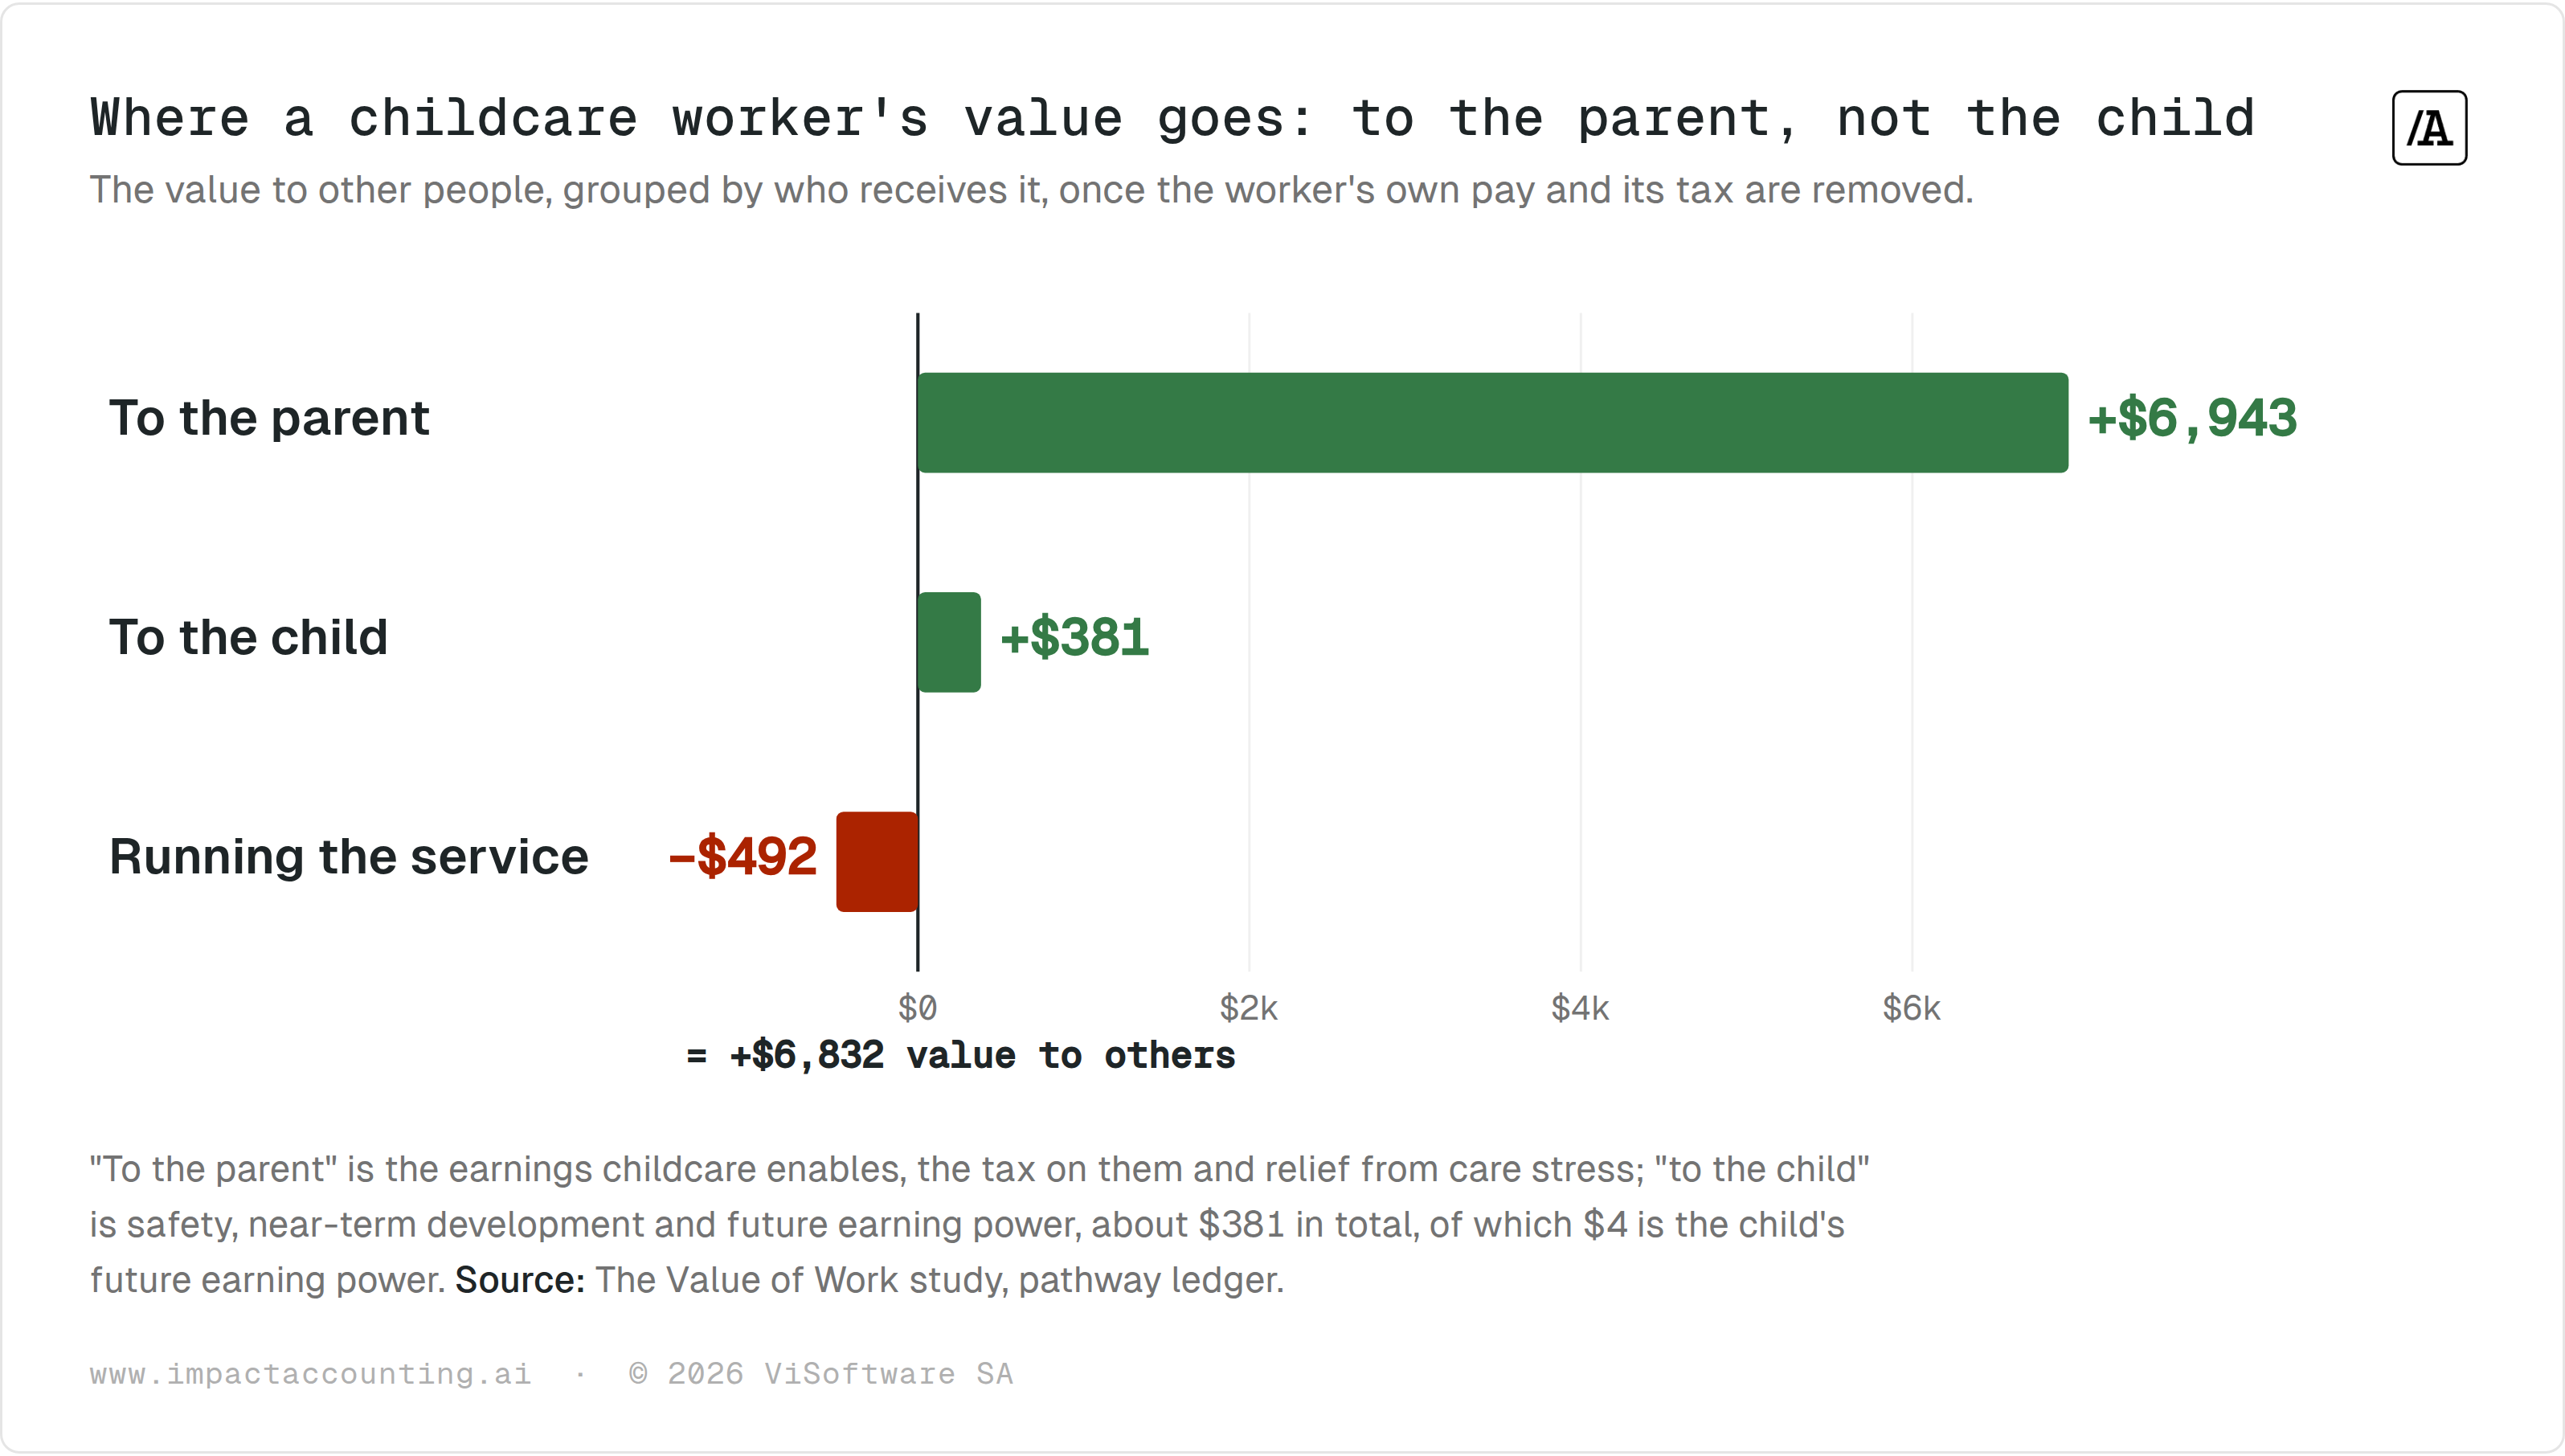
This is the feminist-economics critique appearing inside our own ledger. The accounts see care most clearly where it touches paid work, the parent's wages and the tax on them, and go almost silent on what the worker does for the child, because that value is diffuse, decades away and hard to price. We cannot fully separate two readings, that the marginal developmental value really is small under our counterfactual, or that the model under-captures it. That difficulty is itself the point Marilyn Waring and Nancy Folbre make: value the accounts were never built to see tends not to be seen.
$4 is the value our accounts place on the child's future earning power. The teacher, doing the same early human-capital work a few years later, is credited $115,581 in downstream tax alone. The gap is a measurement artefact as much as a fact.
The primary school teacher
A teacher earns the state more in future tax than the teacher is paid.
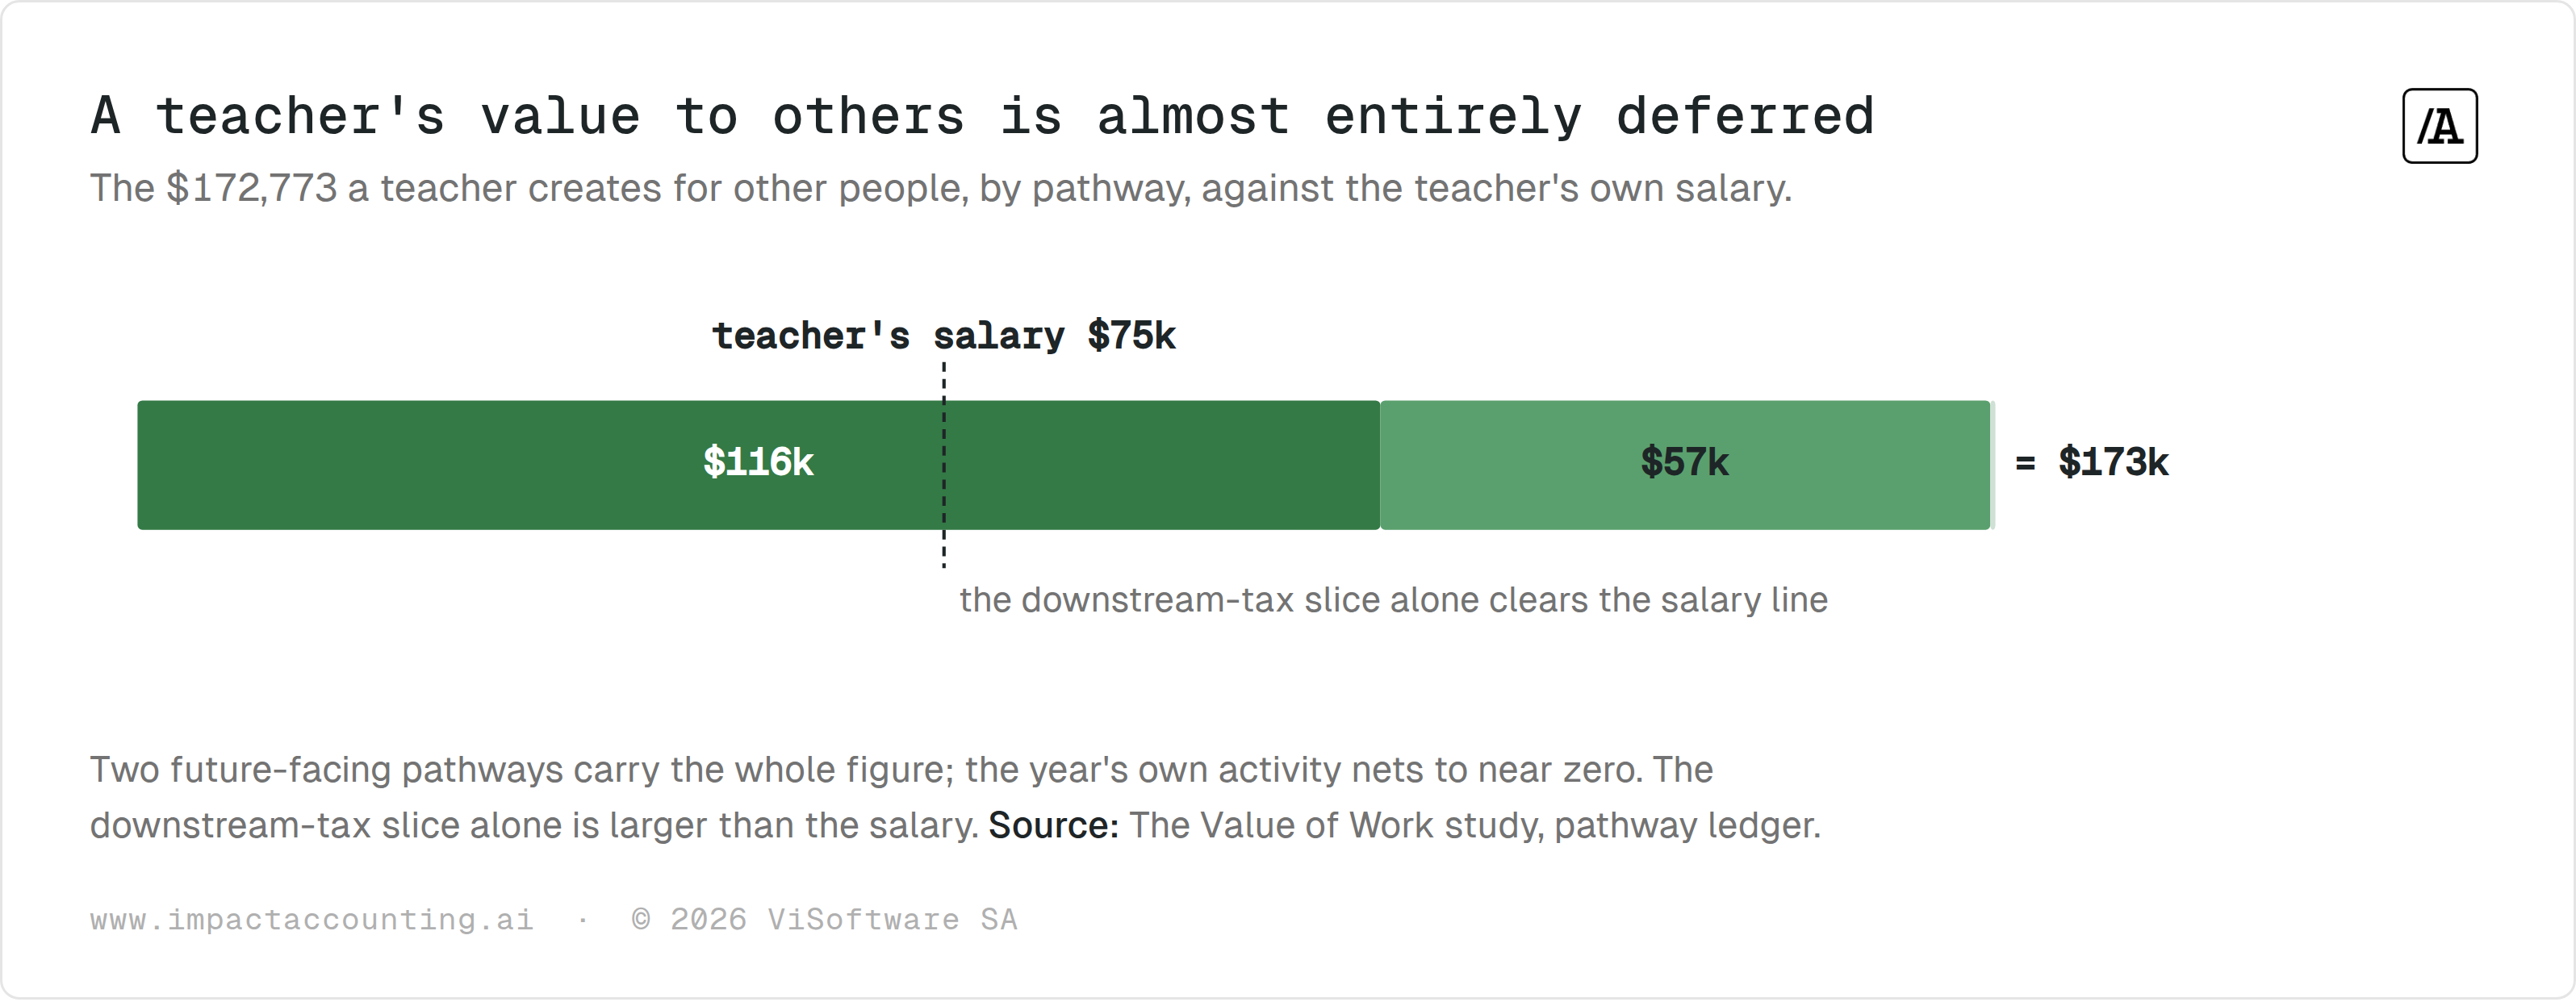
The teacher creates about $172,773 of value for other people, and almost all of it has not happened yet. Two pathways carry the entire figure: $56,719 in pupils' foundational learning and future earning capacity, and $115,581 in the downstream tax those higher earnings will eventually pay. Everything that happens in the actual year of teaching, the classroom, the building, the energy, nets to about $473.
That concentration is also this figure's weakness, and it is worth naming as plainly as we name the chief executive's. Almost the whole number depends on assumptions about what today's pupils will earn decades from now and how those earnings are discounted back. Move those assumptions and the teacher moves a long way with them.
$115,581 of downstream tax from pupils' future earnings, larger than the teacher's $75,000 salary. On these assumptions the state recovers more in future tax from one year of teaching than it pays the teacher to do it.
This is why a market cannot price the job. The people who benefit, the adults those pupils become and the treasury that taxes them, cannot pay the teacher today. The value is real, large and almost entirely deferred, exactly the kind of value a market built to reward what can be captured now will systematically underpay.
The city bus driver
The bus driver's value is almost entirely other people's access.
The bus driver creates about $146,665 of value for other people, the best return per dollar of pay in the whole study, and almost none of it is about the bus. It is about access. Getting people to work and protecting their income accounts for about $46,941. Getting them to services, care and each other, essential-services access, healthcare, assisted mobility and staying connected, comes to about $78,593. The money households save by not needing another way to travel adds $20,009, and cleaner air and a lower carbon footprint about $7,803.
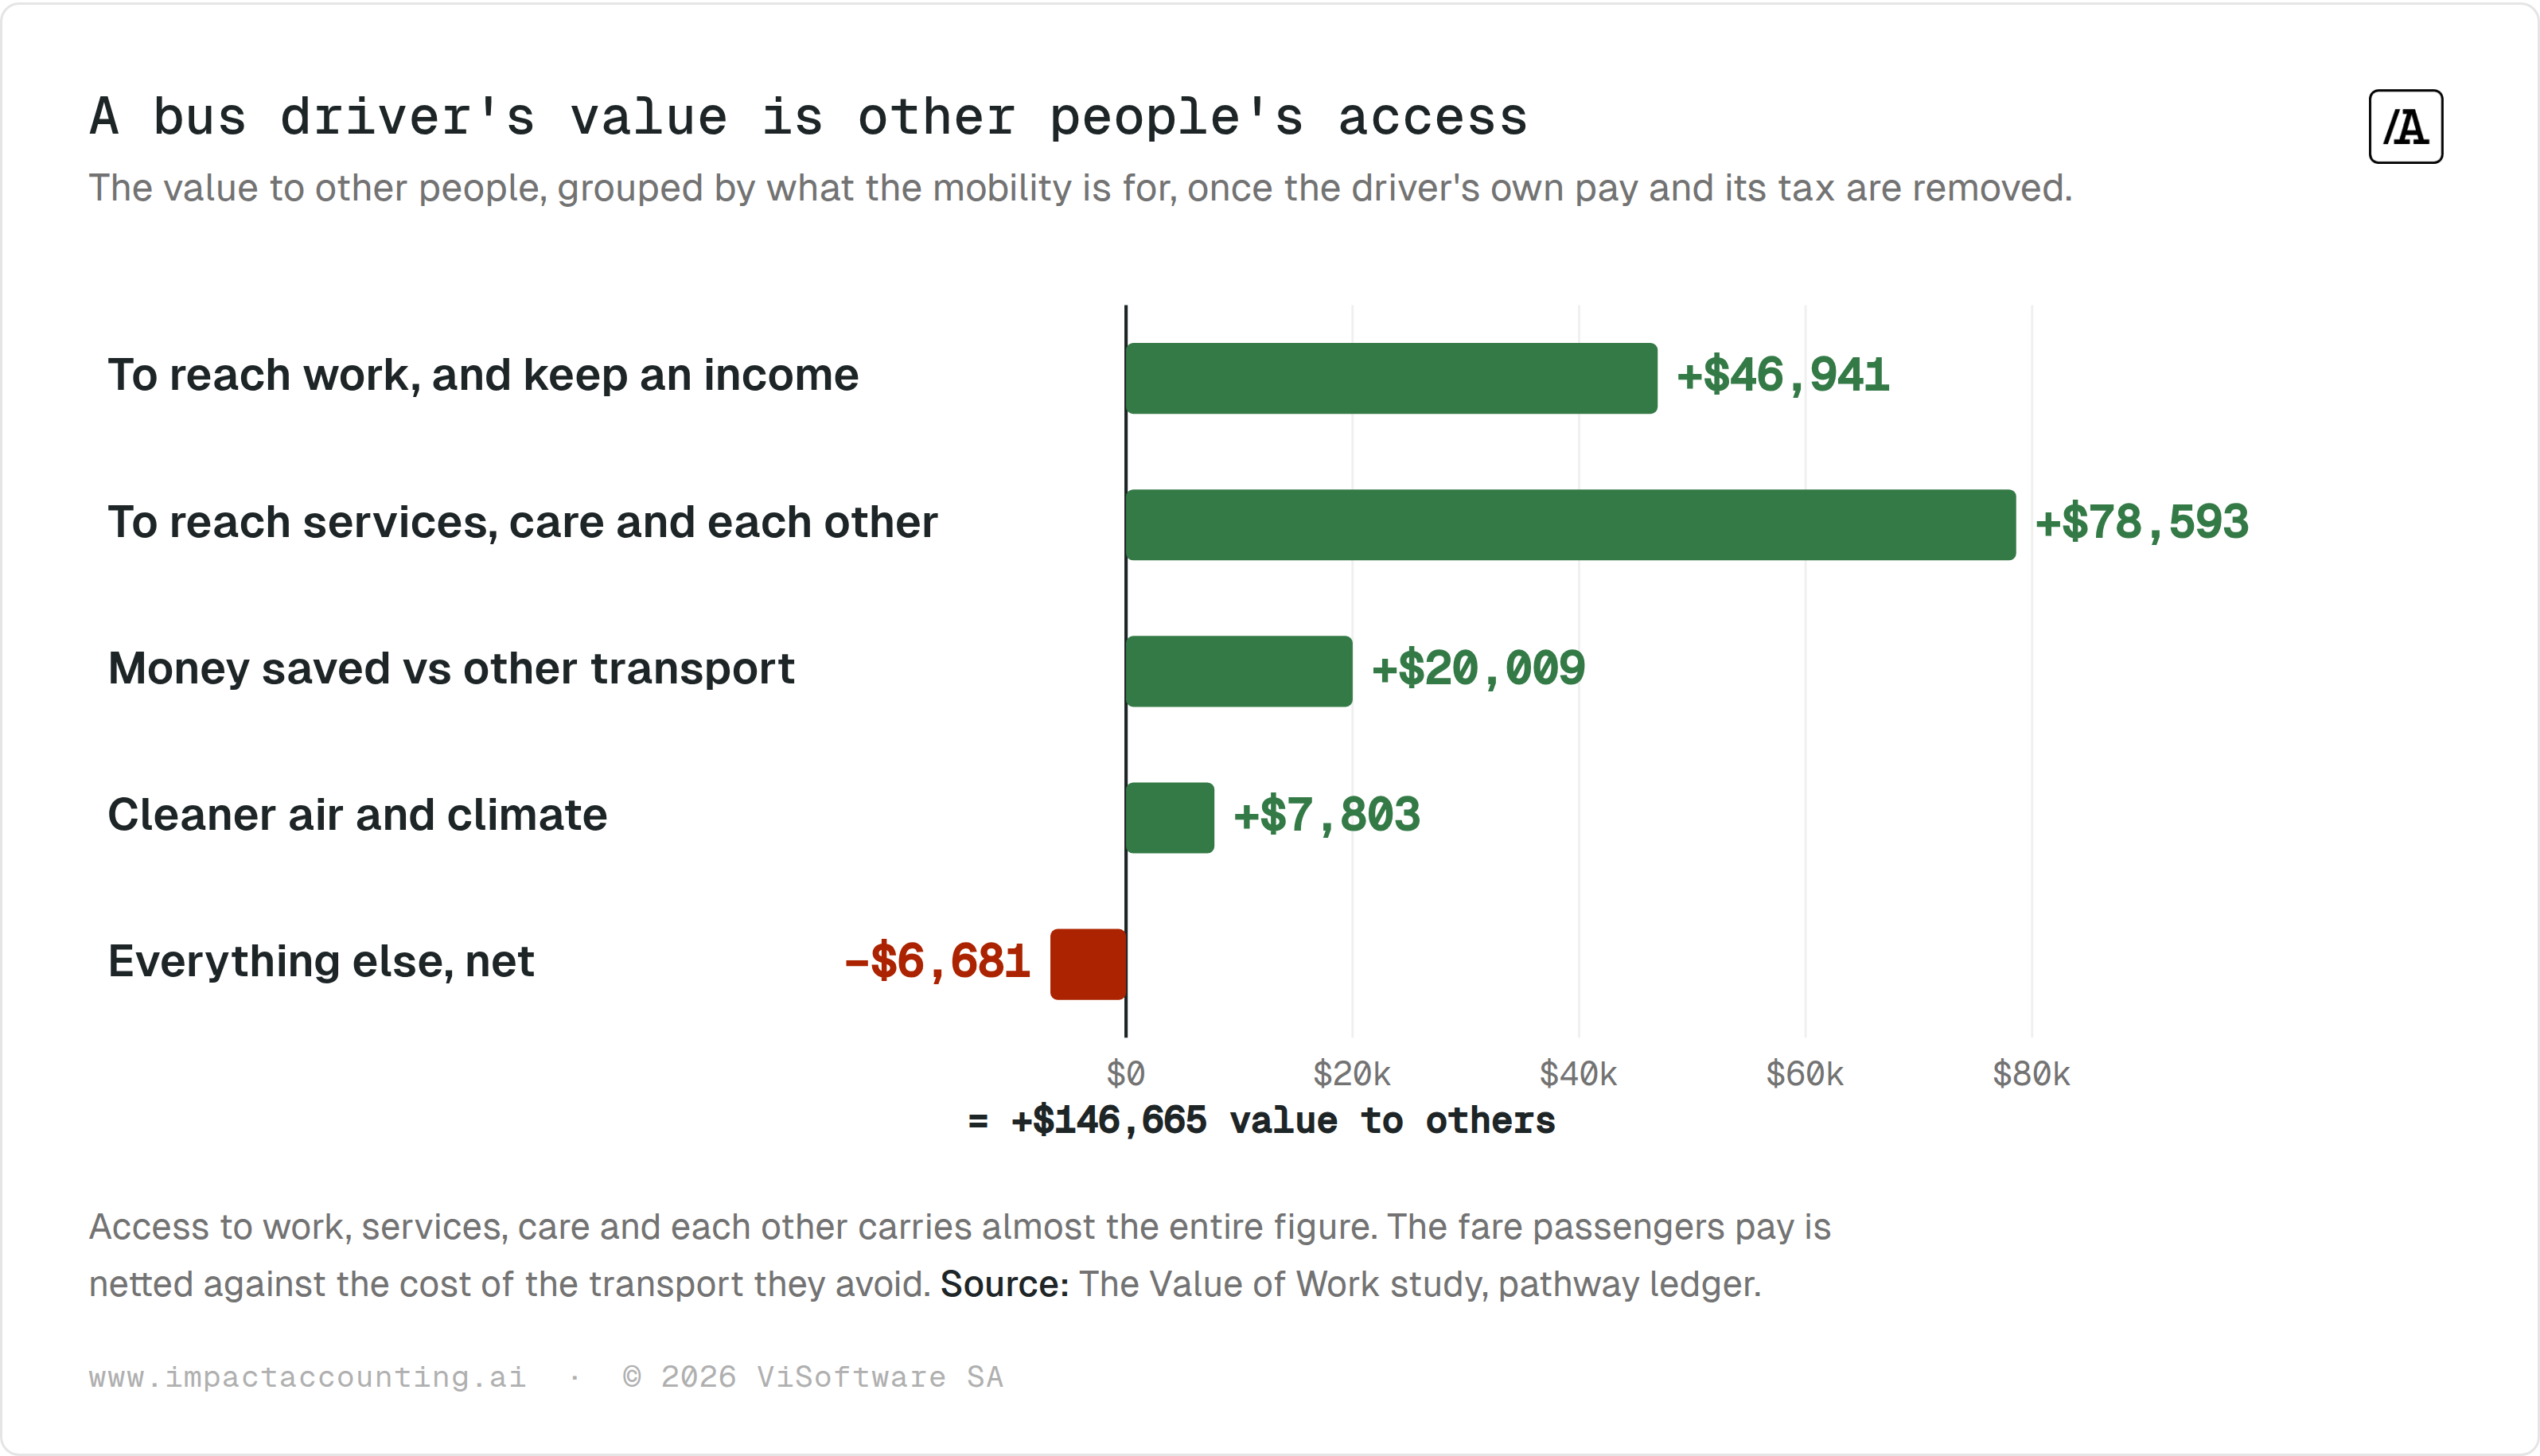
+$2.60 returned to other people for every $1 the bus driver is paid, the highest ratio in the study. What it buys is other people's mobility.
This is why the market struggles to price the job. Almost everything the driver creates lands on someone else, a commuter who keeps a job, a patient who reaches a clinic, an older person who is not left isolated, and none of them pay the driver for it. The fare they do pay is already netted against the money they save by not driving, so it is not the story. A market rewards what a worker can capture; the bus driver captures a modest wage and hands the rest, several times over, to everyone else.
The investment banker
The banker's headline is almost entirely the tax on their own salary.
The banker's year totals about $119,842, a figure that looks like real contribution until you see where it comes from. The banker's own wage accounts for about $19,615, and the tax on that wage for about $107,627. Together that is $127,242, more than the entire headline. Everything the work does for people outside the pay packet, once those two are set aside, comes to about −$7,400.
$127,242 is the banker's own wage and the tax on it, more than the whole $119,842 headline. Strip them and what is left for everyone else is a wash.
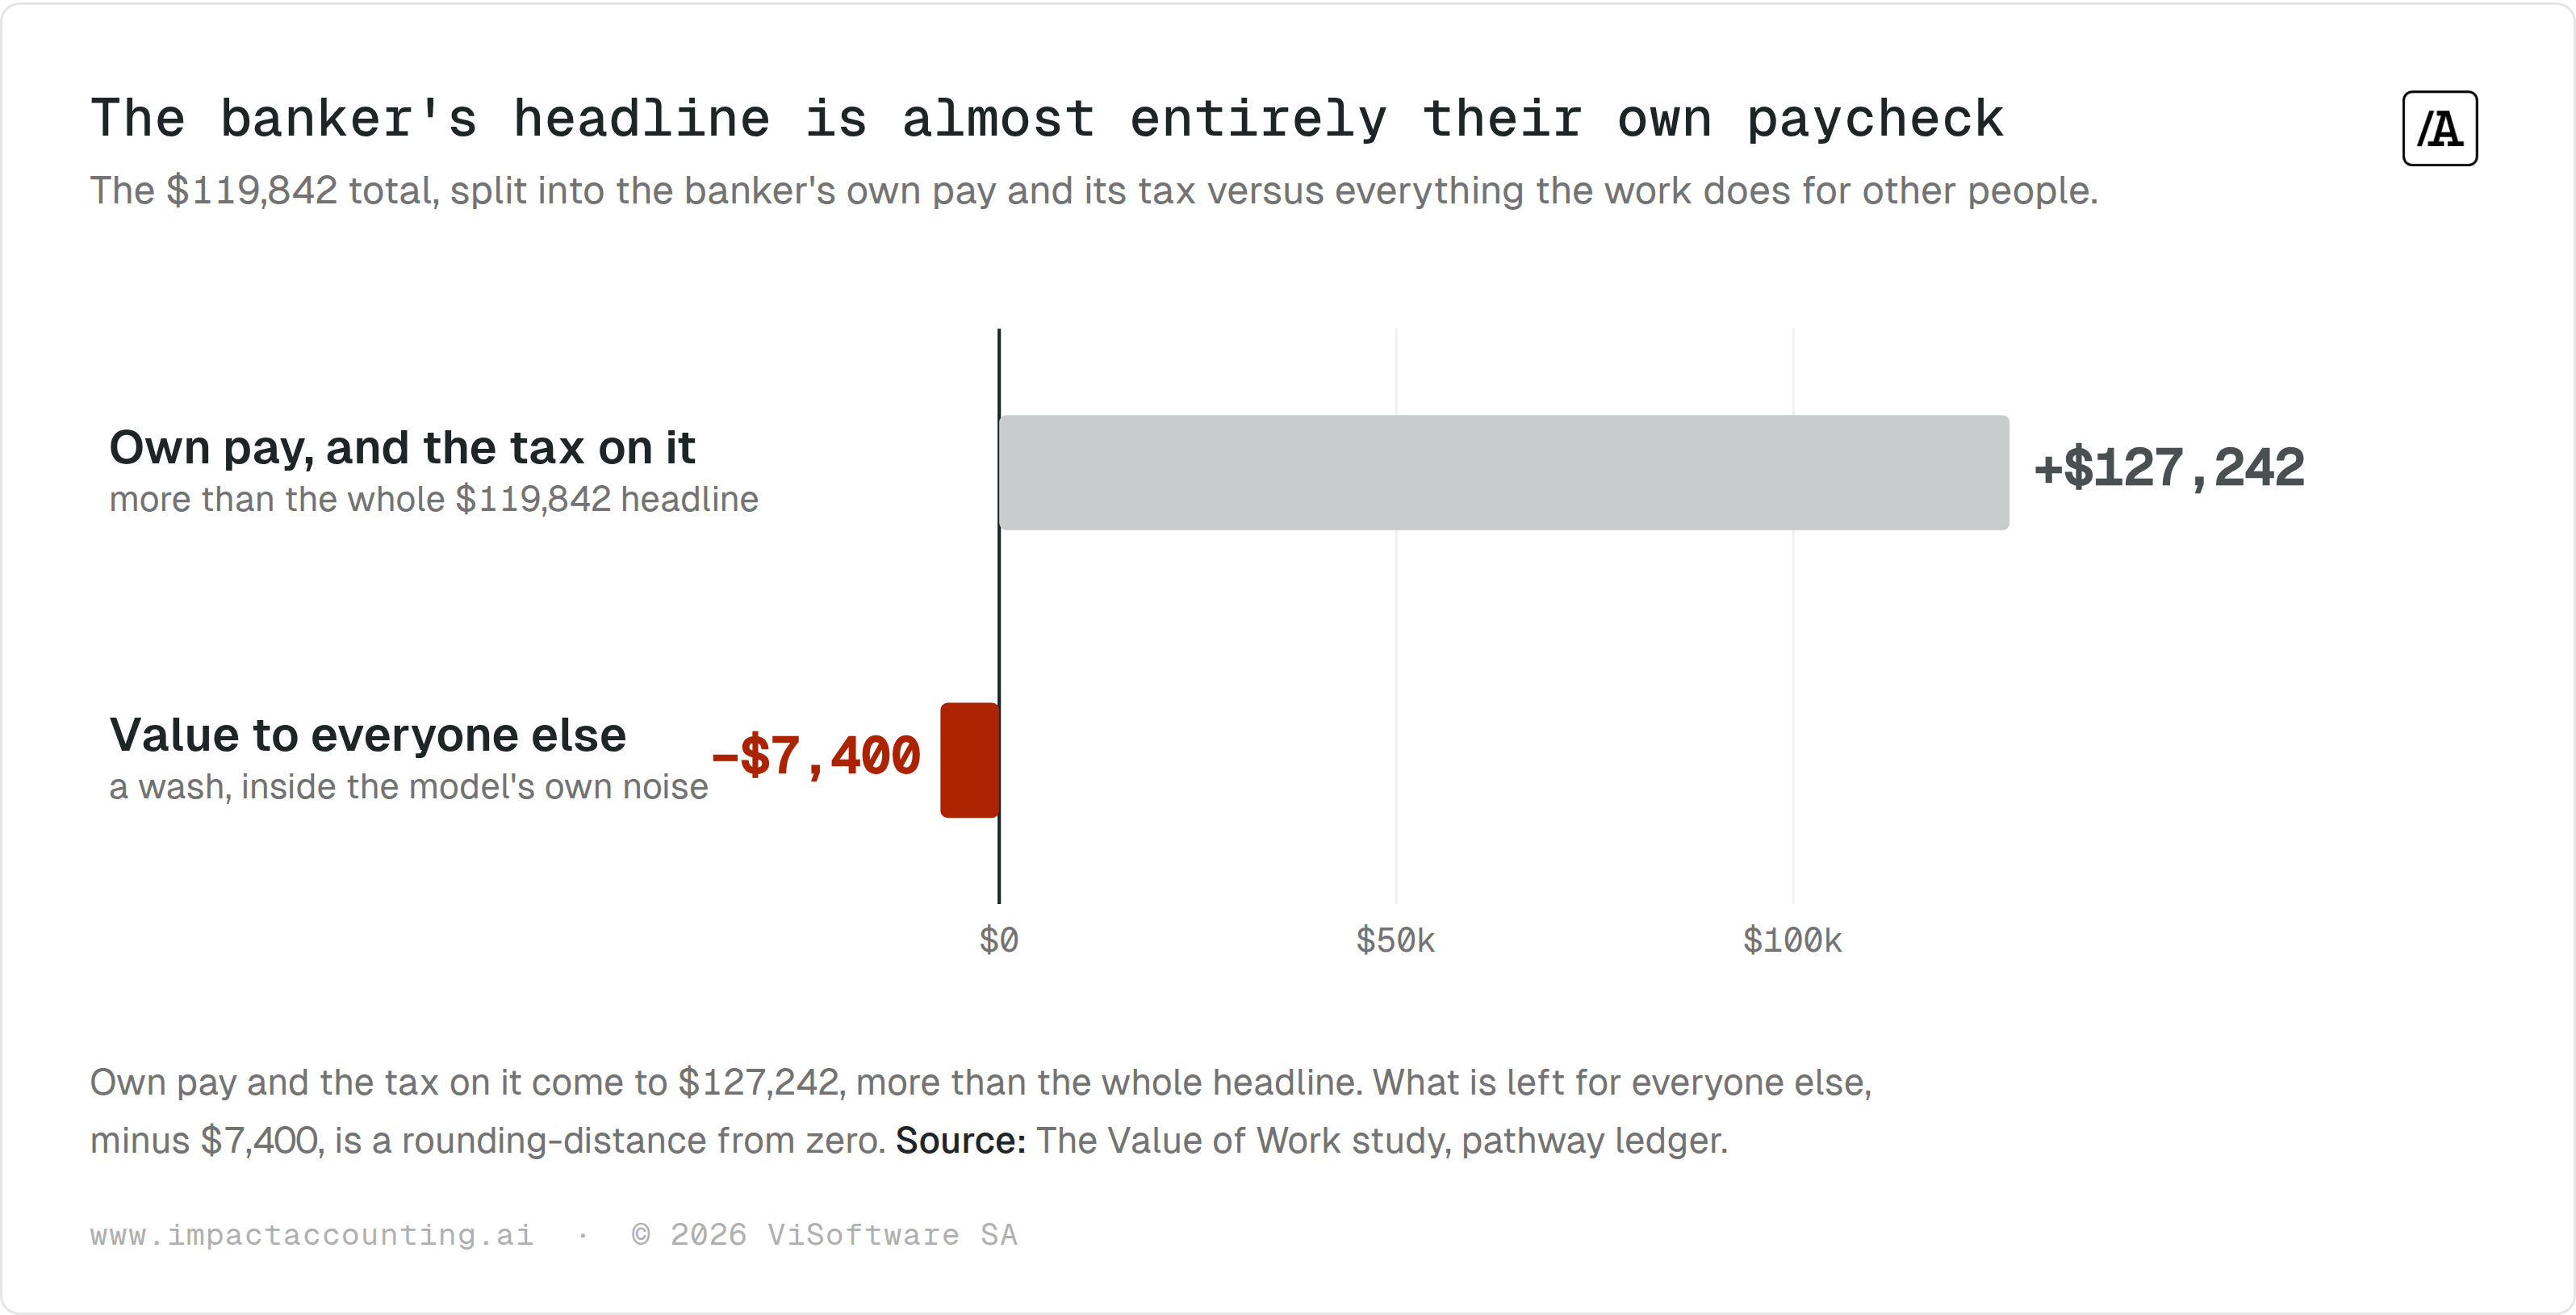
That remaining figure is close enough to zero that we would not read anything into the minus sign. What a banker does for others nets out: roughly $685 of genuine gains, smoother financing, better price information, corporate hedging, against roughly $8,090 of costs, client fees and margins, complex-product losses and a slice of systemic risk. The point is not that the banker destroys value. It is that once you stop crediting the tax on a large salary as a gift to society, the best-paid job in the study does about as much for everyone else as it takes away. Set that beside the bus driver and it is the whole study in one line: the same question, the opposite answer.
Appendix · Assumptions
Applied identically across all fifteen jobs, so the results are comparable.
The 15 jobs selected are a deliberate spread, nine essential or public-facing roles and six well-paid office roles, two of them chosen because we suspected they did more harm than good. They illustrate the range rather than represent the labour market, so the pattern illustrated in the study describes these jobs, not the economy as a whole.
Unit of analysis. Net societal value per full-time-equivalent year, one job at a time. The software values a role in isolation; all cross-job comparison is imposed by us from outside.
Geography. Equal blend of USA, UK and Germany. This makes it a high-income finding and deliberately shrinks catastrophe-avoidance value in water, sanitation and waste, which is handled as a sensitivity rather than re-run.
Additionality. How much of an outcome is genuinely caused by the job rather than happening anyway. The baseline factor is standardised at 40% on the wage and tax pathways; attribution and drop-off stay pathway-specific. Flexed from 30% to 50% in sensitivity.
Pay-stripping. To isolate value to others, the worker's own wage, living-wage gap and own skill premium are removed. Value landing on other people, including beneficiaries, enabled employment and taxes, is kept.
Tax treatment. Tax on the worker's own pay is in the headline and removed in a sensitivity, because it materially changes the pay-to-value relationship. Downstream taxes, such as pupils' future earnings, count as value to others and stay.
Sin-duty exclusion. Tax arising from a job's own harmful output, such as gambling duty, is excluded, since counting it would double-count the harm with a flipped sign.
Comparability. The software's native return-on-investment ratio uses a different denominator per job and is not comparable across jobs. We benchmark on value per dollar of pay, one consistent denominator, treated as an ordering.
Salaries. Gross pay is a provisional analyst estimate on the same geography blend, pending sourcing from a single wage database.