

Explanation
Double materiality, or what a model can evidence
Most double materiality assessments are strong on the financial axis and thin on the impact one. A walk through the double materiality matrix and the ESRS evidence pack on Nestlé's assessment — what a valuation can evidence, and where the analyst still decides.
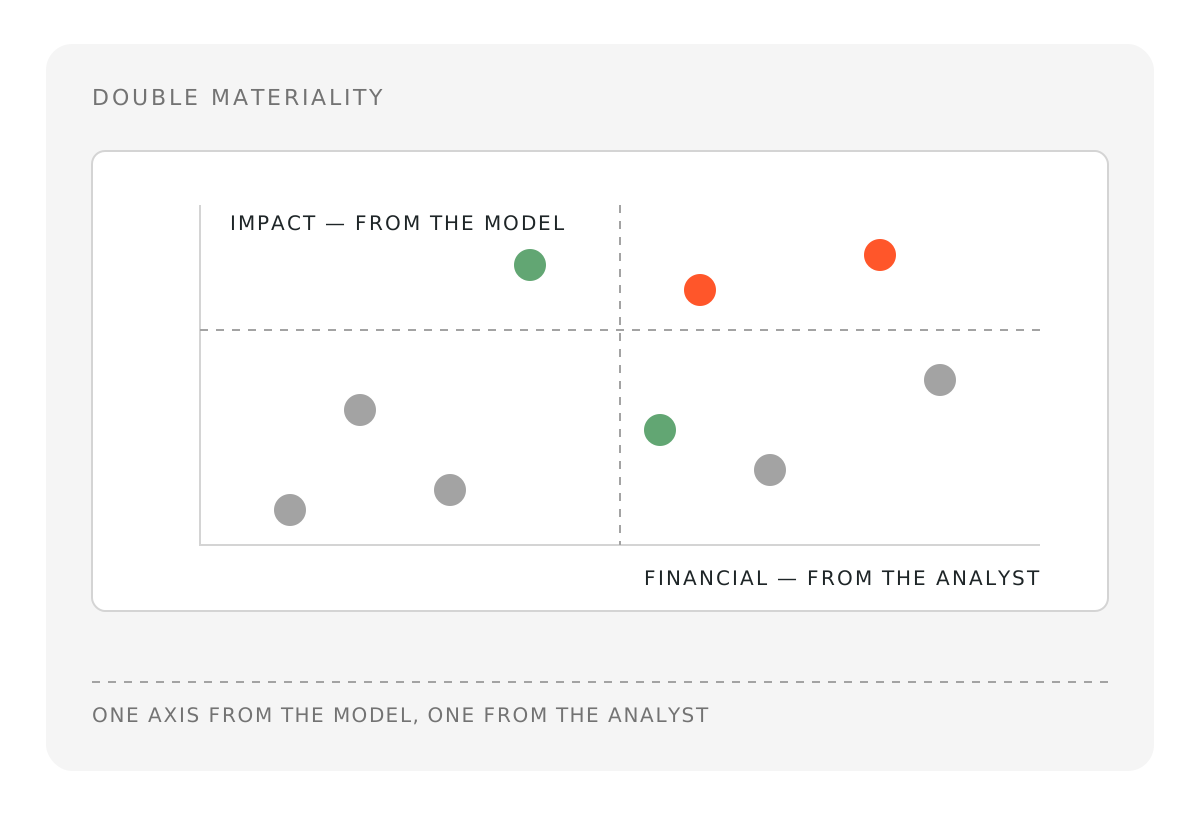
Most double materiality assessments are strong on one axis and thin on the other. Finance and risk teams have years of practice estimating how sustainability matters hit the business. The other direction, how the business hits people and nature, usually comes down to a workshop, a survey and a heat map, and when an auditor asks why one topic scored higher than another the honest answer is that a room agreed it did.
An impact valuation can put numbers behind that axis. It will not settle the assessment, and it repays careful reading. This walks through the double materiality and CSRD/ESRS outputs on Nestlé's assessment, which models 43 pathways to a net societal value of minus 35.5 billion dollars, split across natural capital at minus 66.1 billion, human capital at plus 23 billion and social capital at plus 7.5 billion.
What the section gives you
Open the assessment, go to Insights, then Regulatory. Three tabs sit underneath, of which the first two matter here. Double materiality produces the matrix and the topic-by-topic scoring. CSRD / ESRS re-presents the same model as an evidence pack in the physical units the standards ask for.
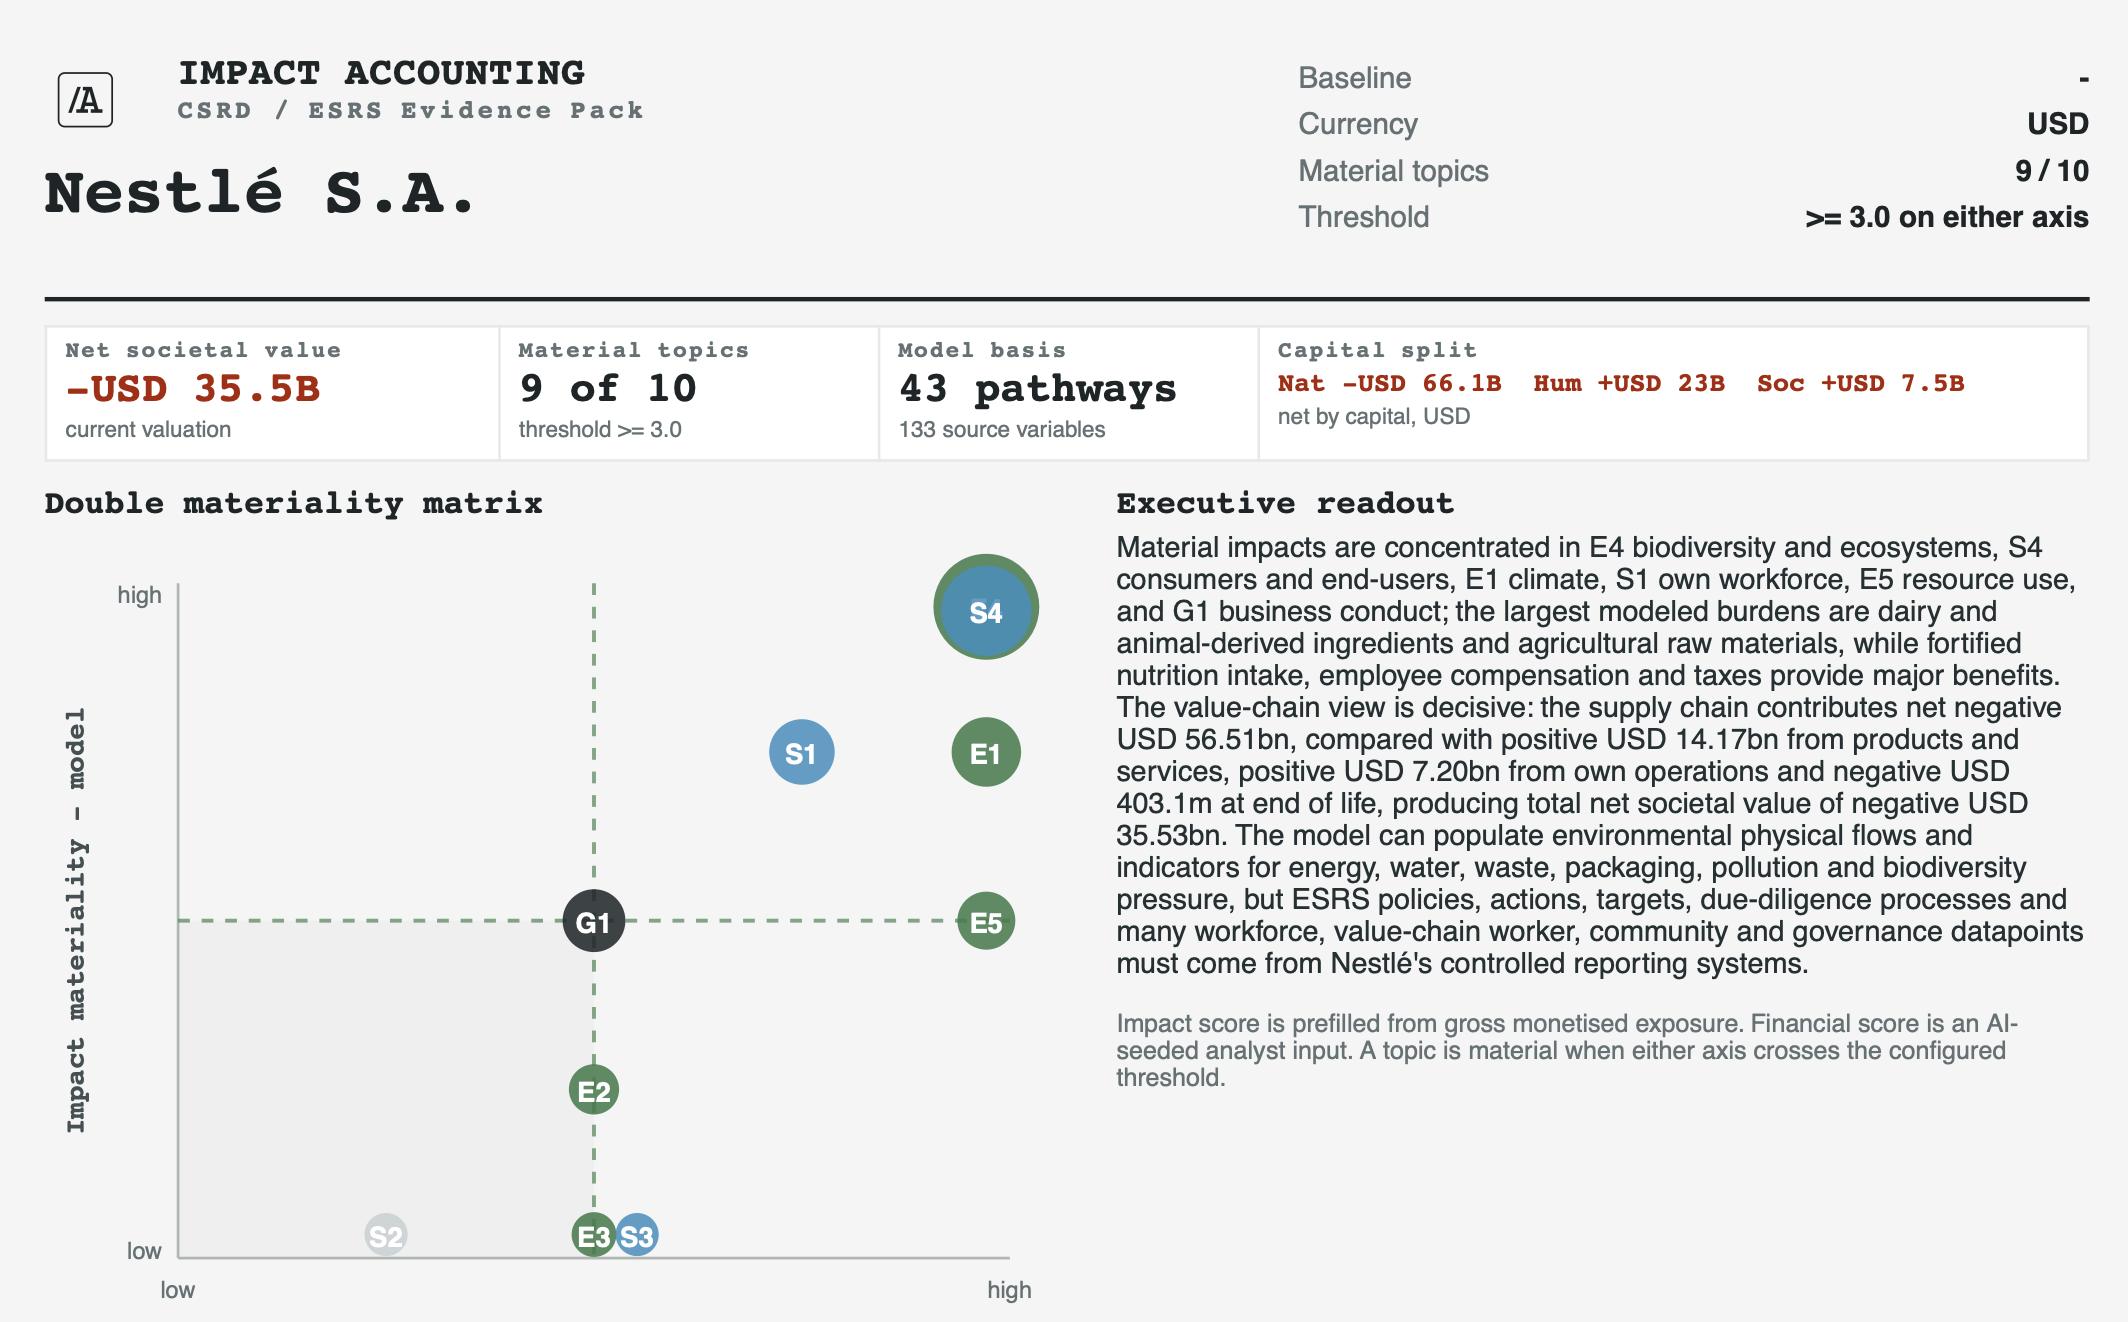
Neither tab runs a new valuation. Both re-present the existing model, and the header strip carries the same totals throughout so you can see which assessment you are reading. Regenerate refreshes a tab after the underlying valuation changes. Download takes the pack out. Ranking for double materiality is manually adjustable below the matrix, individually for each indicator, on both axes.
The framing at the top of the section is worth reading rather than skipping. It describes the output as evidence for the assessment and prefilled datapoints, and says the model estimates support and document the assessment rather than replacing reported inventories or analyst judgement. Everything below depends on that distinction holding.
Reading the matrix
Two axes, two kinds of evidence
The matrix looks like one output. It is two, and they come from different places.
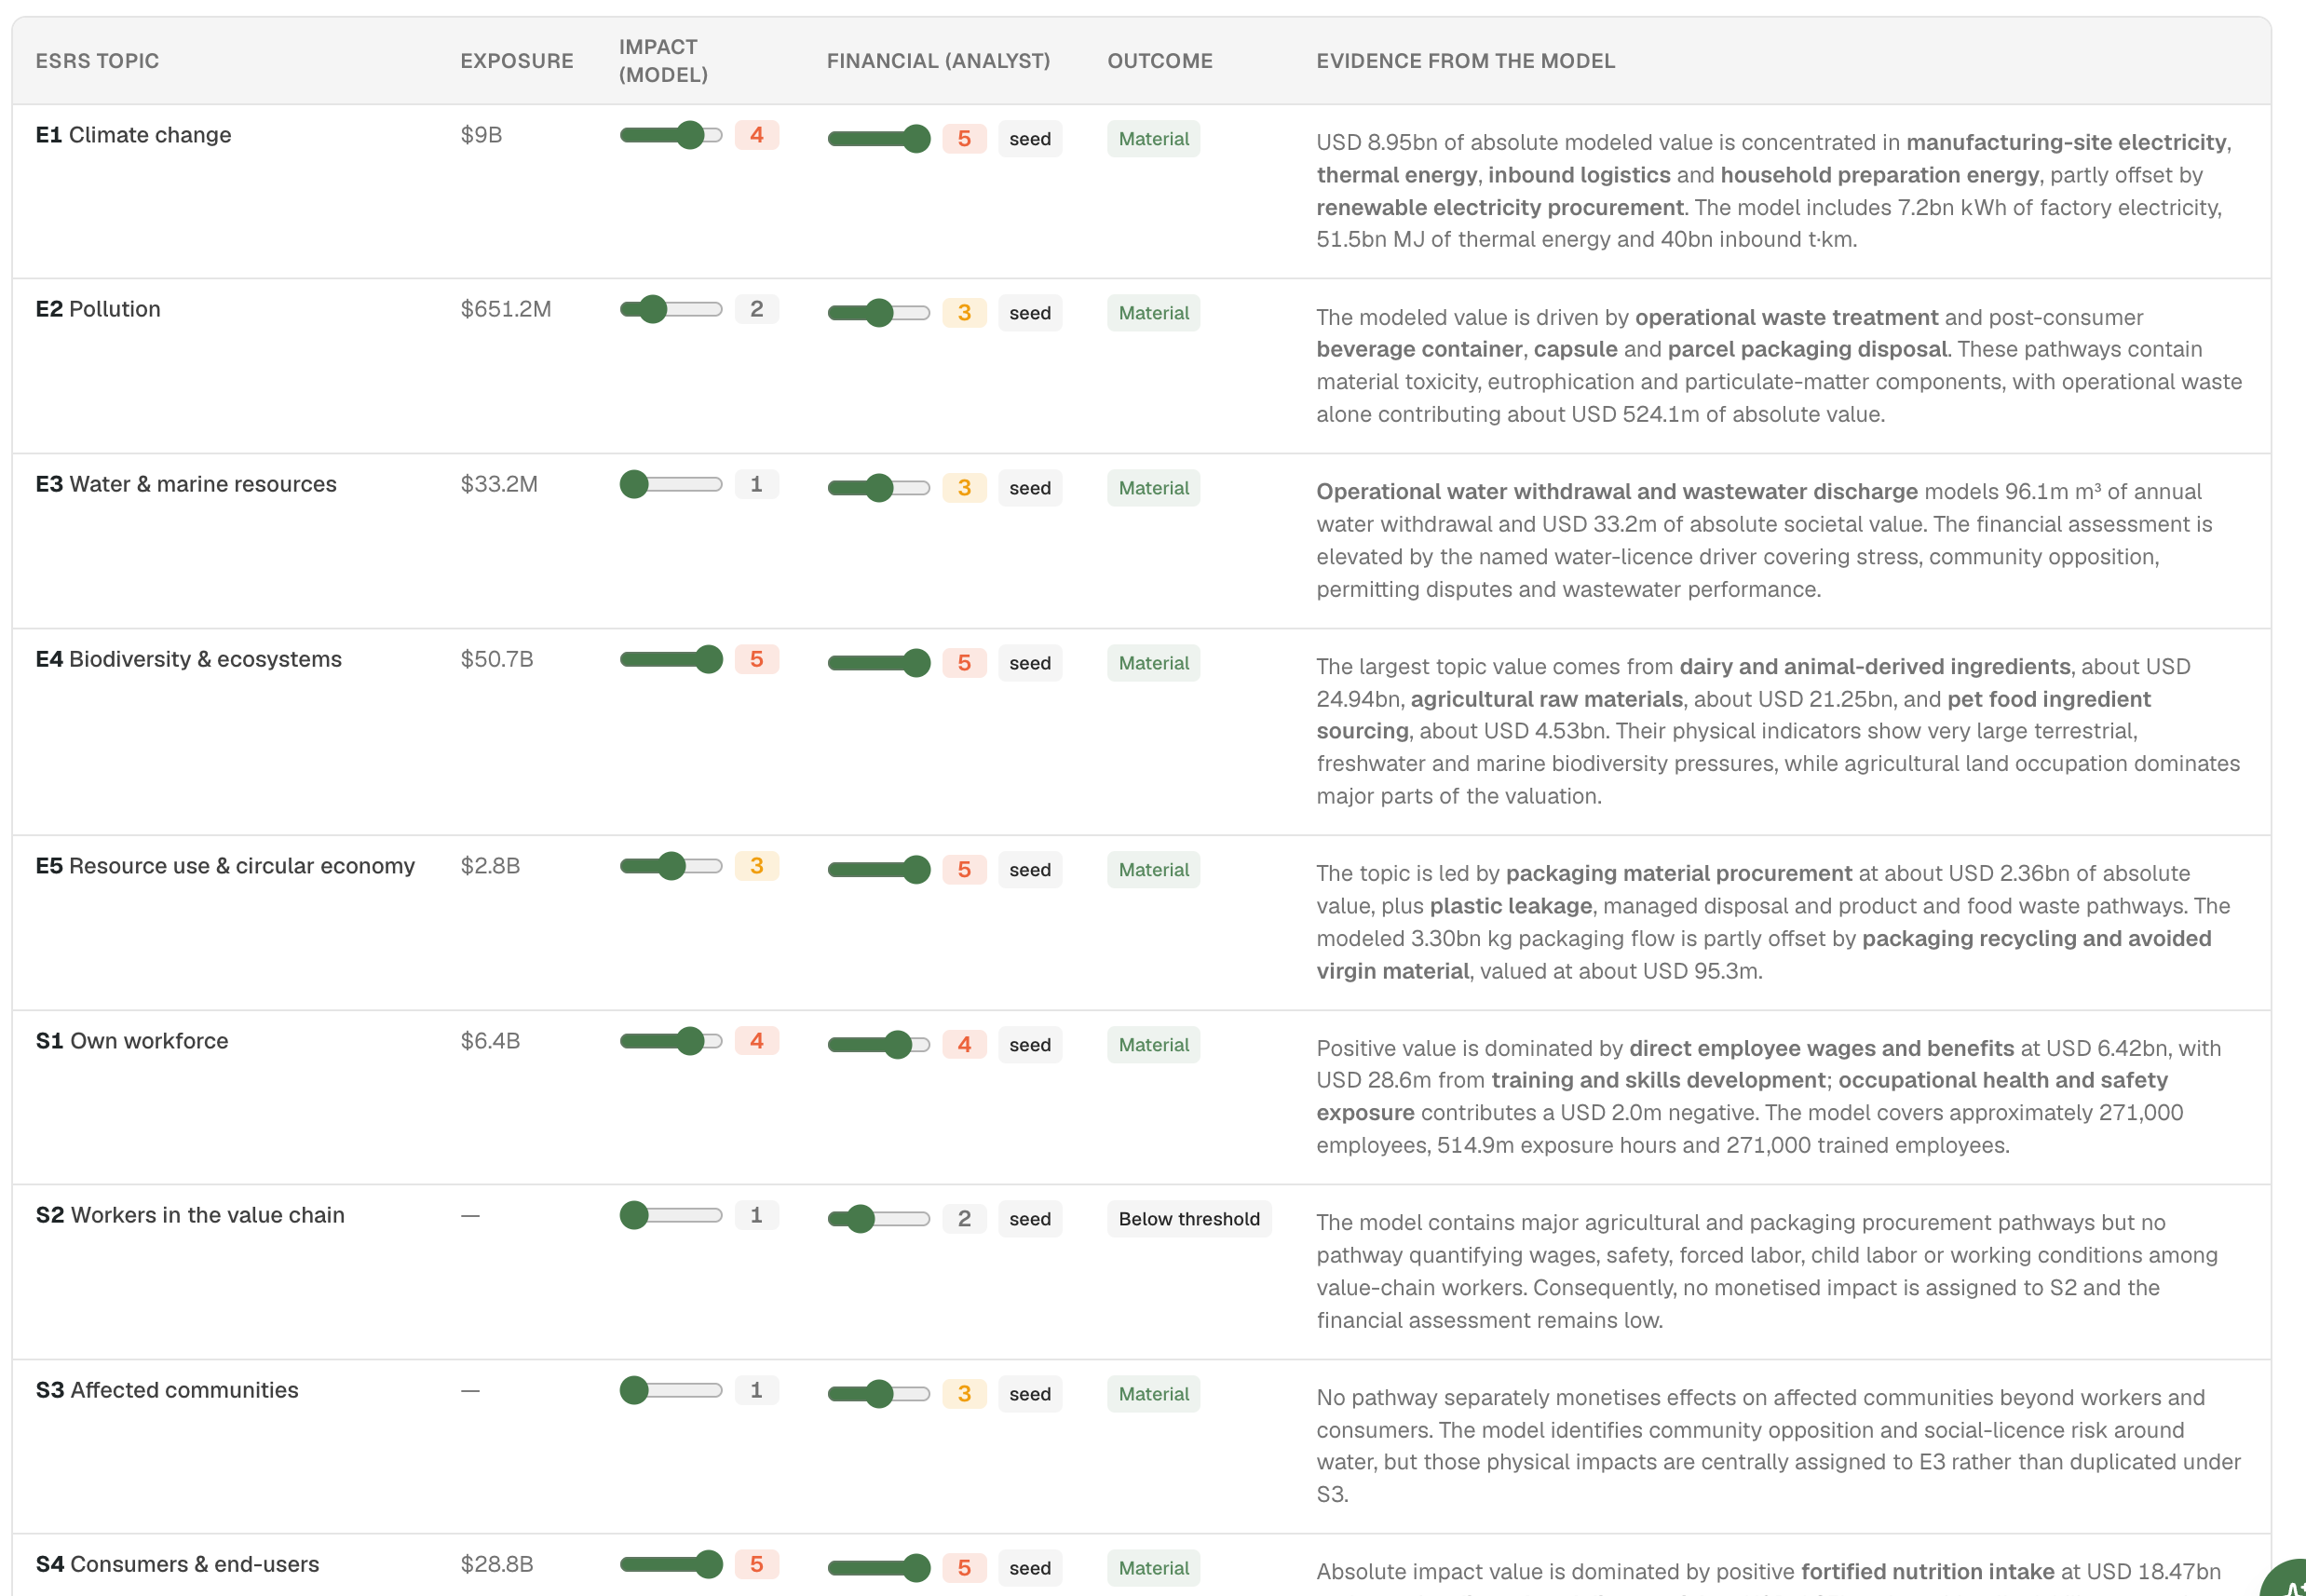
Impact materiality, the vertical axis, is prefilled deterministically from each topic's gross monetised exposure, with no judgement in the starting position, just the model sorted by size. Financial materiality, the horizontal axis, is an analyst input seeded by the model's risk and opportunity drivers. A person sets it.
That difference decides how much weight each axis can carry. A topic sitting high has a large modelled impact and the pathways to show for it. A topic sitting far right has an analyst's view, informed by the model but not produced by it. Presenting the matrix as a single model output overstates the second axis and invites a challenge that is hard to answer.
Two Nestlé topics are material on the analyst axis alone. Water and marine resources scores 1 on impact against 3 on financial, with only 33.2 million dollars of exposure. Affected communities scores 1 against 3 with no exposure figure at all. Both are reportable. Neither got there through the model.
What a low score can mean
Each topic also carries an evidence note explaining what sits behind its score, and that note is worth reading alongside the number.
Workers in the value chain is the one topic of ten that falls below the threshold. It scores 1 on impact materiality, and the model's own evidence note explains why. The model contains major agricultural and packaging procurement pathways but no direct pathway quantifying wages, safety, forced labour, child labour or working conditions among those workers. So the score is 1 because the model has less granularity, not because there is nothing there. A refinement of the model on those points would be important to plan here using the software.
The same habit applies across the matrix. A score reflects what the model currently covers as much as the size of the effect, and the note is where that shows.
Reading the ESRS evidence pack
The second tab reorganises the same model by ESRS topic, in the physical units the standards ask for, computed from the valuation rather than generated. Each card carries the physical indicators, the linked monetised pathways, and a note about what the model covers.
The value chain decides the answer
The executive readout puts it in one line. Nestlé's supply chain contributes net negative 56.51 billion dollars, products and services positive 14.17 billion, own operations positive 7.20 billion, and end of life negative 403.1 million, producing the net negative 35.53 billion.
Own operations are net positive. Almost the entire burden sits upstream.
The physical indicators say the same thing in every unit the standards use. Climate is 89 per cent upstream. Water consumption is 99 per cent upstream. Terrestrial biodiversity is 98 per cent upstream, and agricultural land occupation is 100 per cent upstream. Nothing in this profile is visible from inside the factory gate.
That has a direct consequence for scoping. An assessment drawn around own operations would find a company creating societal value and reach the opposite conclusion from one drawn around the value chain. The standards require the wider boundary, but the practical point is sharper than compliance. The boundary decides the answer before any scoring begins.
Two sign conventions on one card
Each topic card runs two columns, and they use the word positive to mean opposite things.
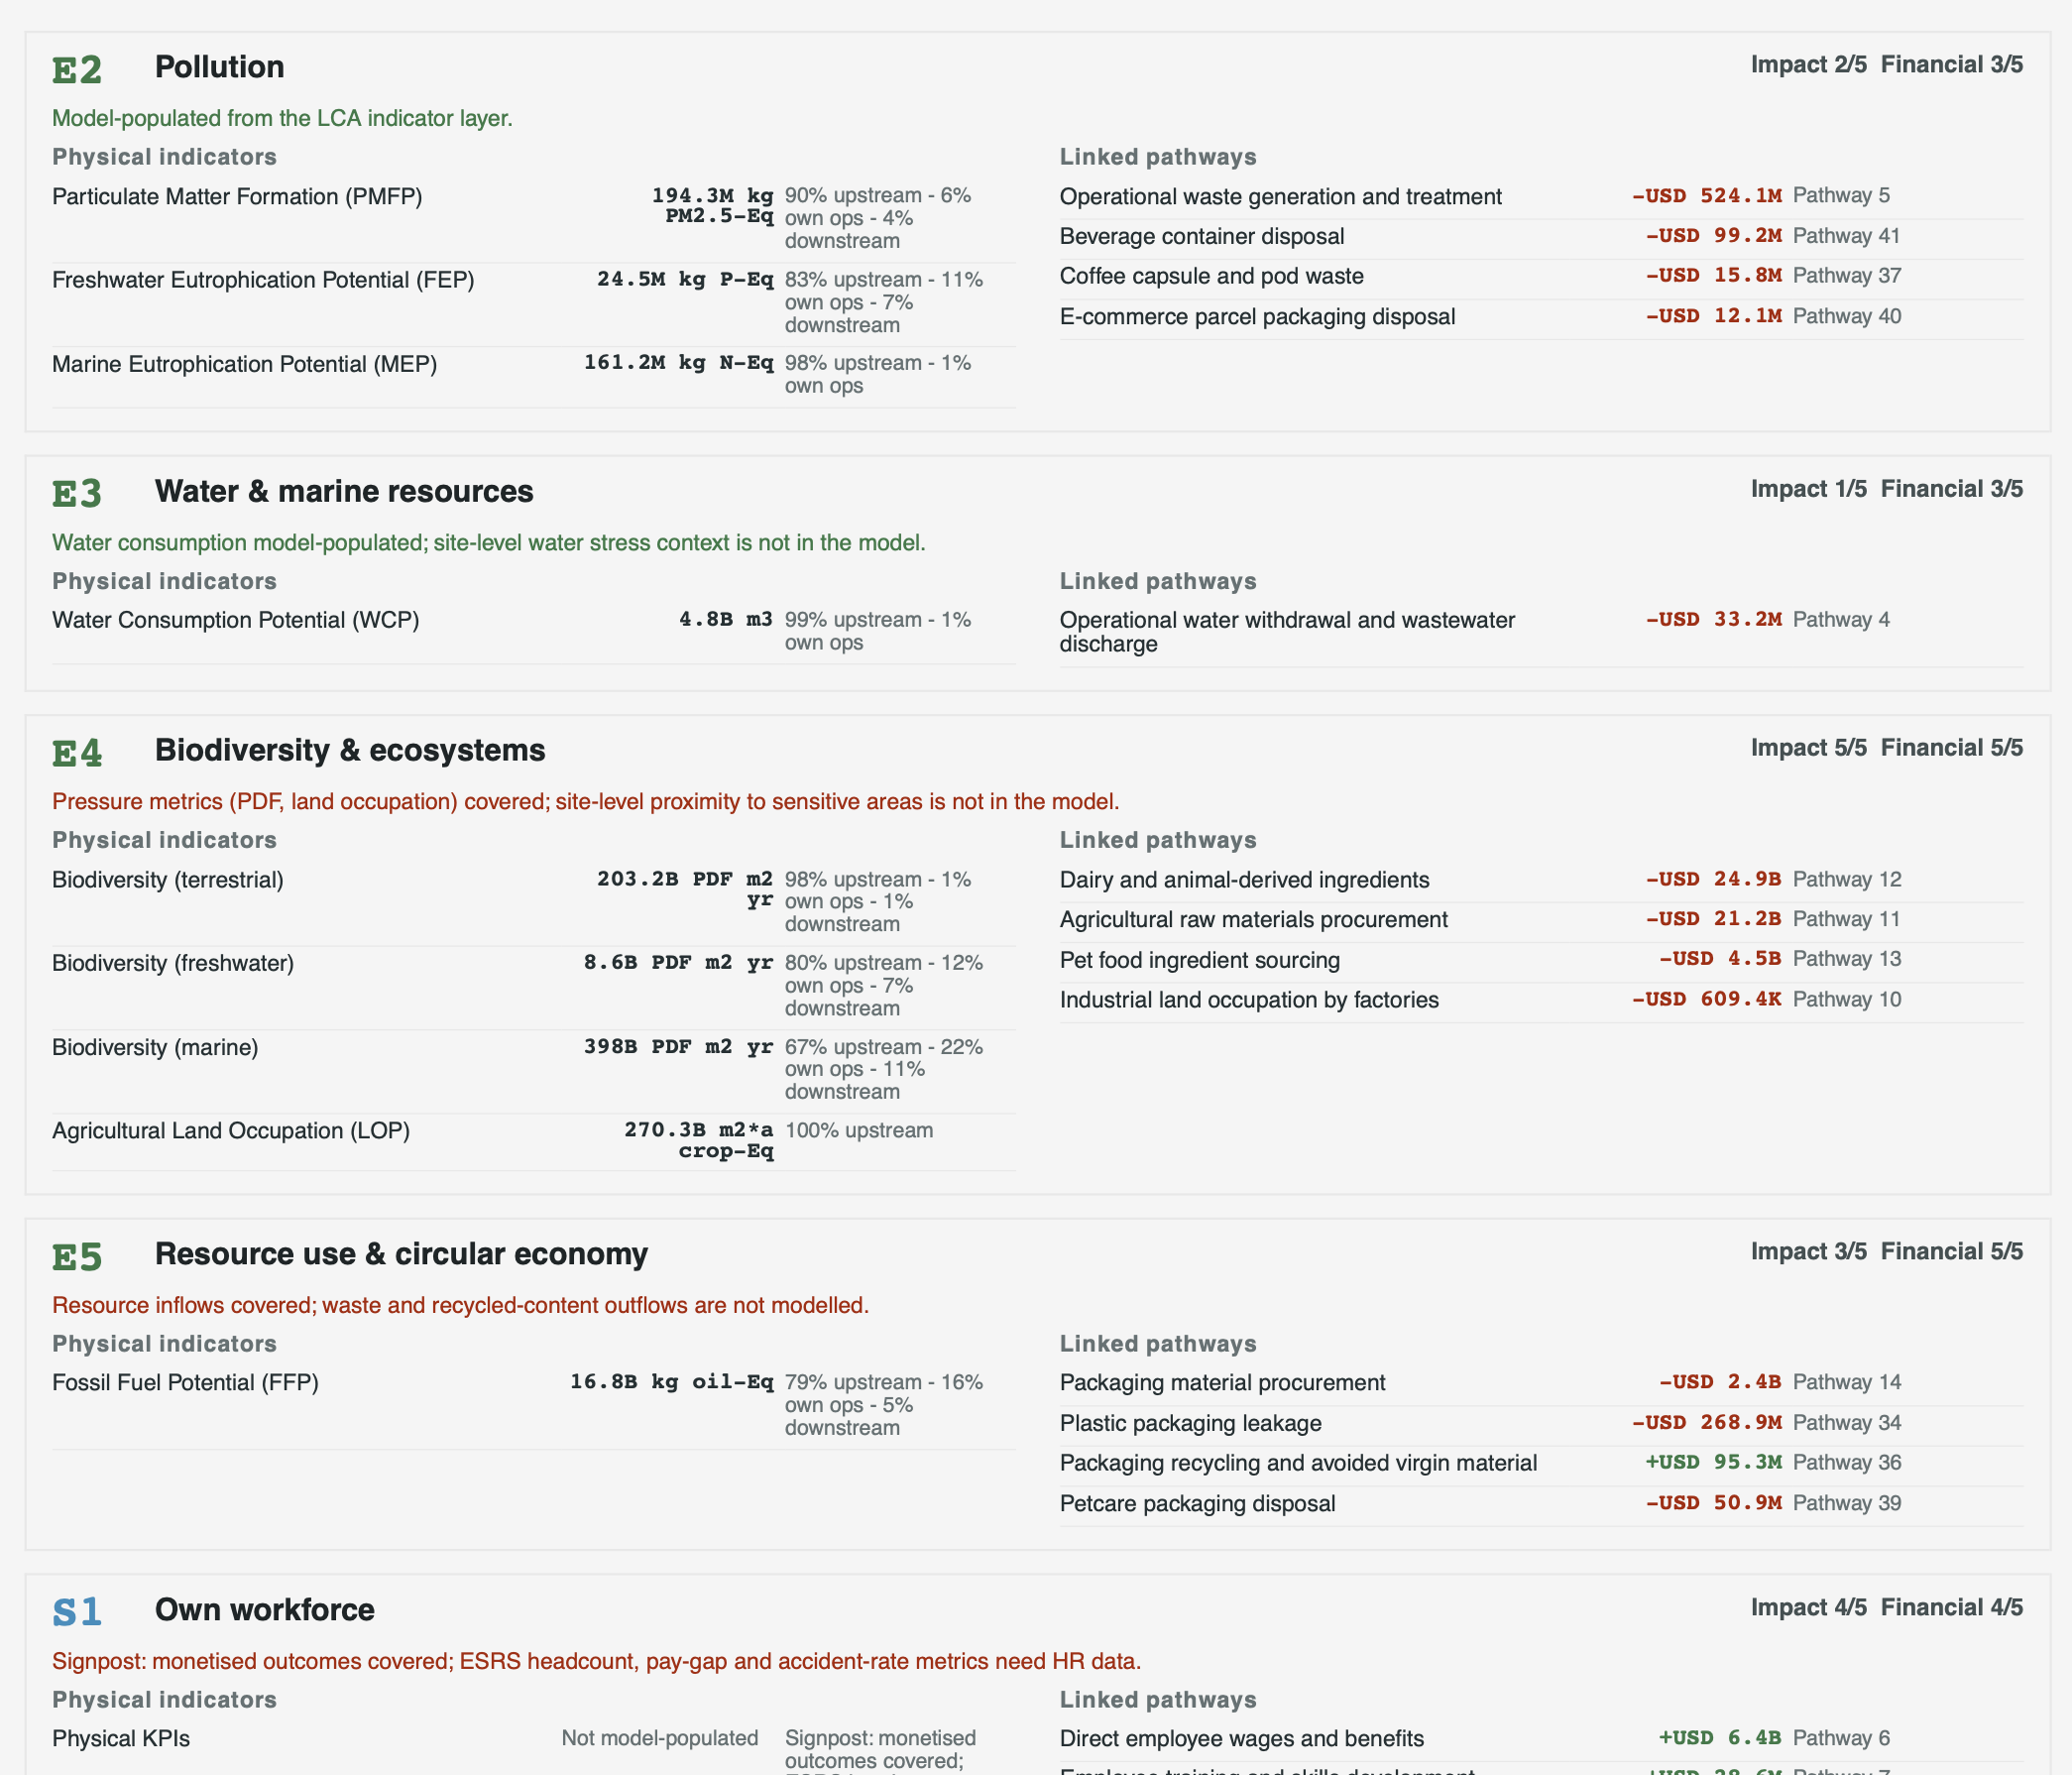
Physical indicators are quantities. Positive means emitted, consumed or occupied. Climate at 124.9 billion kg CO2-equivalent, water at 4.8 billion cubic metres, terrestrial biodiversity at 203.2 billion PDF square-metre-years. Bigger is worse and nothing is ever negative.
Monetised pathways are values. Negative means societal value destroyed and positive means societal value created. Resource use and circular economy shows this inside a single card, with packaging material procurement at minus 2.4 billion, plastic packaging leakage at minus 268.9 million, petcare packaging disposal at minus 50.9 million, and packaging recycling and avoided virgin material at plus 95.3 million.
One number in that list is good news. Anyone scanning for the largest figures rather than reading the signs will get the topic backwards.
A related subtlety sits in the scoring. Topic exposure is gross, so a positive pathway adds to a topic's exposure exactly as a negative one does. Own workforce carries 6.4 billion dollars of exposure and scores 4 on impact materiality, and all of it is beneficial, being direct employee wages and benefits at 6.4 billion plus training and skills development at 28.6 million. High impact materiality does not mean harm. It means the model has something large to say.
The red notes are the work plan
Each card carries a coverage note, and the colour is the signal. Green means the model populated the topic. Red means it did not, or not fully.
Three of Nestlé's cards are red. Biodiversity has pressure metrics covered but no site-level proximity to sensitive areas. Resource use has inflows covered but no waste or recycled-content outflows. Own workforce has monetised outcomes covered while the ESRS headcount, pay-gap and accident-rate metrics need HR data, and its physical KPI row reads "not model-populated" rather than showing a number.
Read together, those notes are a data-collection plan built from the company's own impact profile rather than from a generic checklist. They say which system each missing datapoint has to come from, and they distinguish what the model cannot know from what nobody has collected yet. The executive readout makes the same division at the top level, noting that the model can populate environmental physical flows for energy, water, waste, packaging, pollution and biodiversity pressure, while policies, actions, targets, due-diligence processes and many workforce, value-chain worker, community and governance datapoints must come from controlled reporting systems.
For most teams that is one of the more useful things on the screen, and it is the part that looks least like a result.
What a heat map cannot show
The standards ask for material impacts in both directions, positive and negative. Most assessments document only the negative, because a workshop scoring exercise has no unit in which to express a benefit and no way to weigh one against a harm.
A valuation does. Nestlé's capital split runs natural capital at minus 66.1 billion dollars against human capital at plus 23 billion and social capital at plus 7.5 billion, and the positives are attached to named pathways rather than asserted. Fortified nutrition intake contributes 18.47 billion under consumers and end-users. Direct employee wages and benefits contribute 6.4 billion under own workforce. Corporate, payroll and operating taxes contribute 4.98 billion under business conduct. Those are reportable positive impacts with evidence behind them, in a format that sits beside the harms rather than in a separate goodwill section.
The ranking is also defensible in a way a show of hands is not. The impact axis is derived from 43 pathways built on 133 source variables, so when someone asks why biodiversity outranks pollution the answer is 50.7 billion dollars of exposure against 651.2 million, with the contributing pathways listed underneath. That is an evidence trail rather than a recollection of who spoke loudest in the room.
And a good deal of reporting work arrives already done. Global warming potential, water consumption, terrestrial, freshwater and marine biodiversity, agricultural land occupation and fossil fuel potential all come through in the units the standards ask for, each split across upstream, own operations and downstream. That split is a requirement, and it is usually one of the more laborious parts of a first reporting cycle.
None of this settles the assessment. It changes what the workshop starts from, which is a ranked and sourced set of impacts to argue with rather than an empty matrix.
Working with the result
Three things are worth doing before this reaches a workshop.
1. Move the scores and the threshold, and watch what happens. Both are adjustable, and changes are logged for the IRO-1 process description, so the audit trail builds itself as you work. Nestlé currently has nine of ten topics material at a threshold of 3 on either axis. Whether that is the right cut is a scoping decision, and it is better made deliberately than inherited.
2. Ask the chat why a topic scored what it did. The evidence column is truncated on screen and the reasoning behind a score is more useful than the score. This is the fastest route to telling a topic with a genuinely small impact apart from one whose pathways are still being built.
3. Regenerate after changing the valuation, then Download the pack. The export carries the pathways, the physical indicators, the value-chain splits and the coverage notes, which means the reader can see where the evidence stops rather than discovering it during assurance.
Where it stops
The section produces evidence for an assessment. It does not produce the assessment.
It does not establish financial materiality, since impact pathways describe effects on people and nature while financial materiality concerns effects on the business, and the analyst axis is seeded by the model rather than derived from it. It does not decide materiality, which also turns on scale, scope, likelihood and remediability. It does not replace stakeholder engagement, because a model can estimate where impacts are largest but not how affected people experience them or whose perspective is missing. And it does not make anyone compliant, since legal scoping, the formal assessment, policies, targets, controls, governance approval and assurance all sit outside it.
Above all it is only as complete as the assessment behind it. Anything outside the boundary is absent from the output, which is what the evidence note on each topic is there to surface.
Background
The Corporate Sustainability Reporting Directive is the EU framework for corporate sustainability reporting, and double materiality is its organising idea. Companies in scope report both how their activities affect people and the environment and how sustainability matters affect their own development, performance and position. The European Sustainability Reporting Standards define what gets reported, across twelve standards covering general requirements, general disclosures, five environmental topics, four social topics and business conduct. Ten of the twelve are topical, which is why the matrix carries ten rows.
Two changes matter for scoping. Directive (EU) 2026/470 entered into force on 18 March 2026 and narrowed the scope to undertakings exceeding both 1,000 employees and 450 million euros in net turnover, with both thresholds required. First application is for financial years beginning on or after 1 January 2027, with first reports expected in 2028, and only limited assurance is now required.
The standards themselves are being simplified. The Commission adopted the revising delegated act on 3 July 2026, cutting mandatory datapoints by roughly 60 per cent. It sits under a scrutiny period during which Parliament and Council can accept or reject it but not amend it, and it enters into force once published in the Official Journal. The revised standards apply for financial years beginning on or after 1 January 2027, with voluntary early application for 2026.
Confirm which version applies before relying on any of it. Scope, reporting year and standard version all move independently.