

Methodology & data
From what happens to what changes: the net impact bridge
Additionality has long been a percentage nobody could check. ImpactAccounting.ai now values every pathway with the organization and in its alternative, keeps the absolute and the additional impact in two columns that are never added, and walks from one to the other with the net impact bridge.
Every impact account eventually meets the same question from a funder. Would this have happened anyway? The answer decides whether a result is worth backing, and for years it has been the weakest part of most impact valuations, ours included. This piece explains how ImpactAccounting.ai now answers it, why the old way caused so much confusion, and what the change means for the people who read accounts and for the experts who calibrate them.
The approach rests on four ideas.
- Every pathway is valued twice, with the organization and in its alternative, instead of being scaled down by an additionality percentage.
- The absolute impact (what happens) and the additional impact (what changes) are two columns that are never added together.
- The net impact bridge walks from one to the other in four steps, with every value counted once.
- Each value sits in one of four boxes, by scenario and by sign, and that matrix explains every result.
The trouble with an additionality percentage
Impact valuation has usually handled the question with a percentage. Each pathway gets an additionality factor, built from a baseline (the share that would have happened anyway), a drop-off and an attribution share, and the factor scales the value down. A training programme whose participants would have found the same jobs three times in ten keeps 70% of its value.
The percentage looks simple, although it creates three problems in practice.
The first is that it hides the alternative. A factor of 70% says nothing about what the participants would have done instead, so a reader cannot check it, challenge it or improve it. Two analysts can apply very different shares to the same kind of pathway, and the account gives no way to see why they differ.
The second is that a percentage cannot describe substitution. Many organizations replace something worse. A low-energy cooling unit replaces an air conditioner that would use several times more electricity, and a plant protein replaces whey with a far heavier production footprint. Much of the value of such an organization lies in harms that no longer happen somewhere else, and a factor between 0 and 100% applied to its own pathways has nowhere to put that value.
The third problem does the most damage, because the reader no longer knows what the total means. In practice some lines carried a percentage and others did not. Supply chain and own operations were often counted in full by convention, while the benefits of products and services were discounted. The total then mixed lines that describe what happens with lines that describe what changes, and nobody could say which question it answered.
Two scenarios instead of a percentage
ImpactAccounting.ai now values every pathway twice. It values it first with the organization, as it operates in the analysis year, and then in its alternative, which is what the people the organization serves would turn to without it, delivered by the provider of that alternative. Two figures follow from one model, and both use the same eQALY value factors.
The absolute impact adds up every pathway with the organization. It describes everything that happens because the organization operates, the way an impact statement or a greenhouse gas inventory does. The additional impact subtracts the alternative from the absolute impact, so it keeps only the difference the organization makes. That is the figure a funder compares before a decision, and the one the SROI (additional) uses.
Additionality has not disappeared. It is now a result rather than an input. Where a pathway has an absolute impact, its additional impact divided by it gives its additionality; a pathway that happens only in the alternative has none, and the bridge shows it directly. The alternative behind that share is written down in words and in inputs that anyone can read and change. Drop-off stays, as the share of an effect lost over its duration, and so does attribution in a narrow sense, the organization's share of an outcome when a partner's own action is needed for it. A funder's stake in the organization leaves the model and is applied in the portfolio view.
A clear rule decides what goes into the alternative, because an alternative can otherwise grow without limit. It starts from the people the organization serves and stops with the provider that would serve them instead, including what that provider needs to do so, counted once. The organization's own sourcing keeps its full footprint, since whatever its suppliers' land or plants would otherwise produce would be made somewhere else anyway. Pay and the taxes on pay, with the organization and in the alternative, count in the additional impact only for the share of workers who would not otherwise be formally employed, read from national employment data. Taxes on sales, spending and profit are the same in both scenarios and cancel. Customer spending has the same average effect in both scenarios. Nothing goes further down the chain, such as how prices or other producers would react, unless the brief names it as part of the impact thesis, because each extra step stacks one uncertain estimate on another.
One more rule keeps the account honest. The main use of every offer, such as the nutrition of a food or the exercise of a sport, is always a pathway, valued in full in both scenarios. When the alternative delivers the same use, the pathway adds its whole value to the absolute impact and nothing to the additional impact. The absolute impact then shows why the organization exists, and the additional impact shows how much of that good would happen anyway.
Two columns, never added
The two figures answer different questions, so they sit in two columns and are never added together. That sounds obvious, although adding them is one of the most common errors in impact reporting.
A mixed total appears whenever an account takes some lines in absolute terms and others in additional terms. A typical version counts the organization's benefits in full, nets its harms against the harms its alternative would have caused, and leaves out the benefits the alternative would have delivered anyway. Each choice looks reasonable on its own line. The total answers neither question, and it changes whenever the same activity is cut into more or fewer pathways.
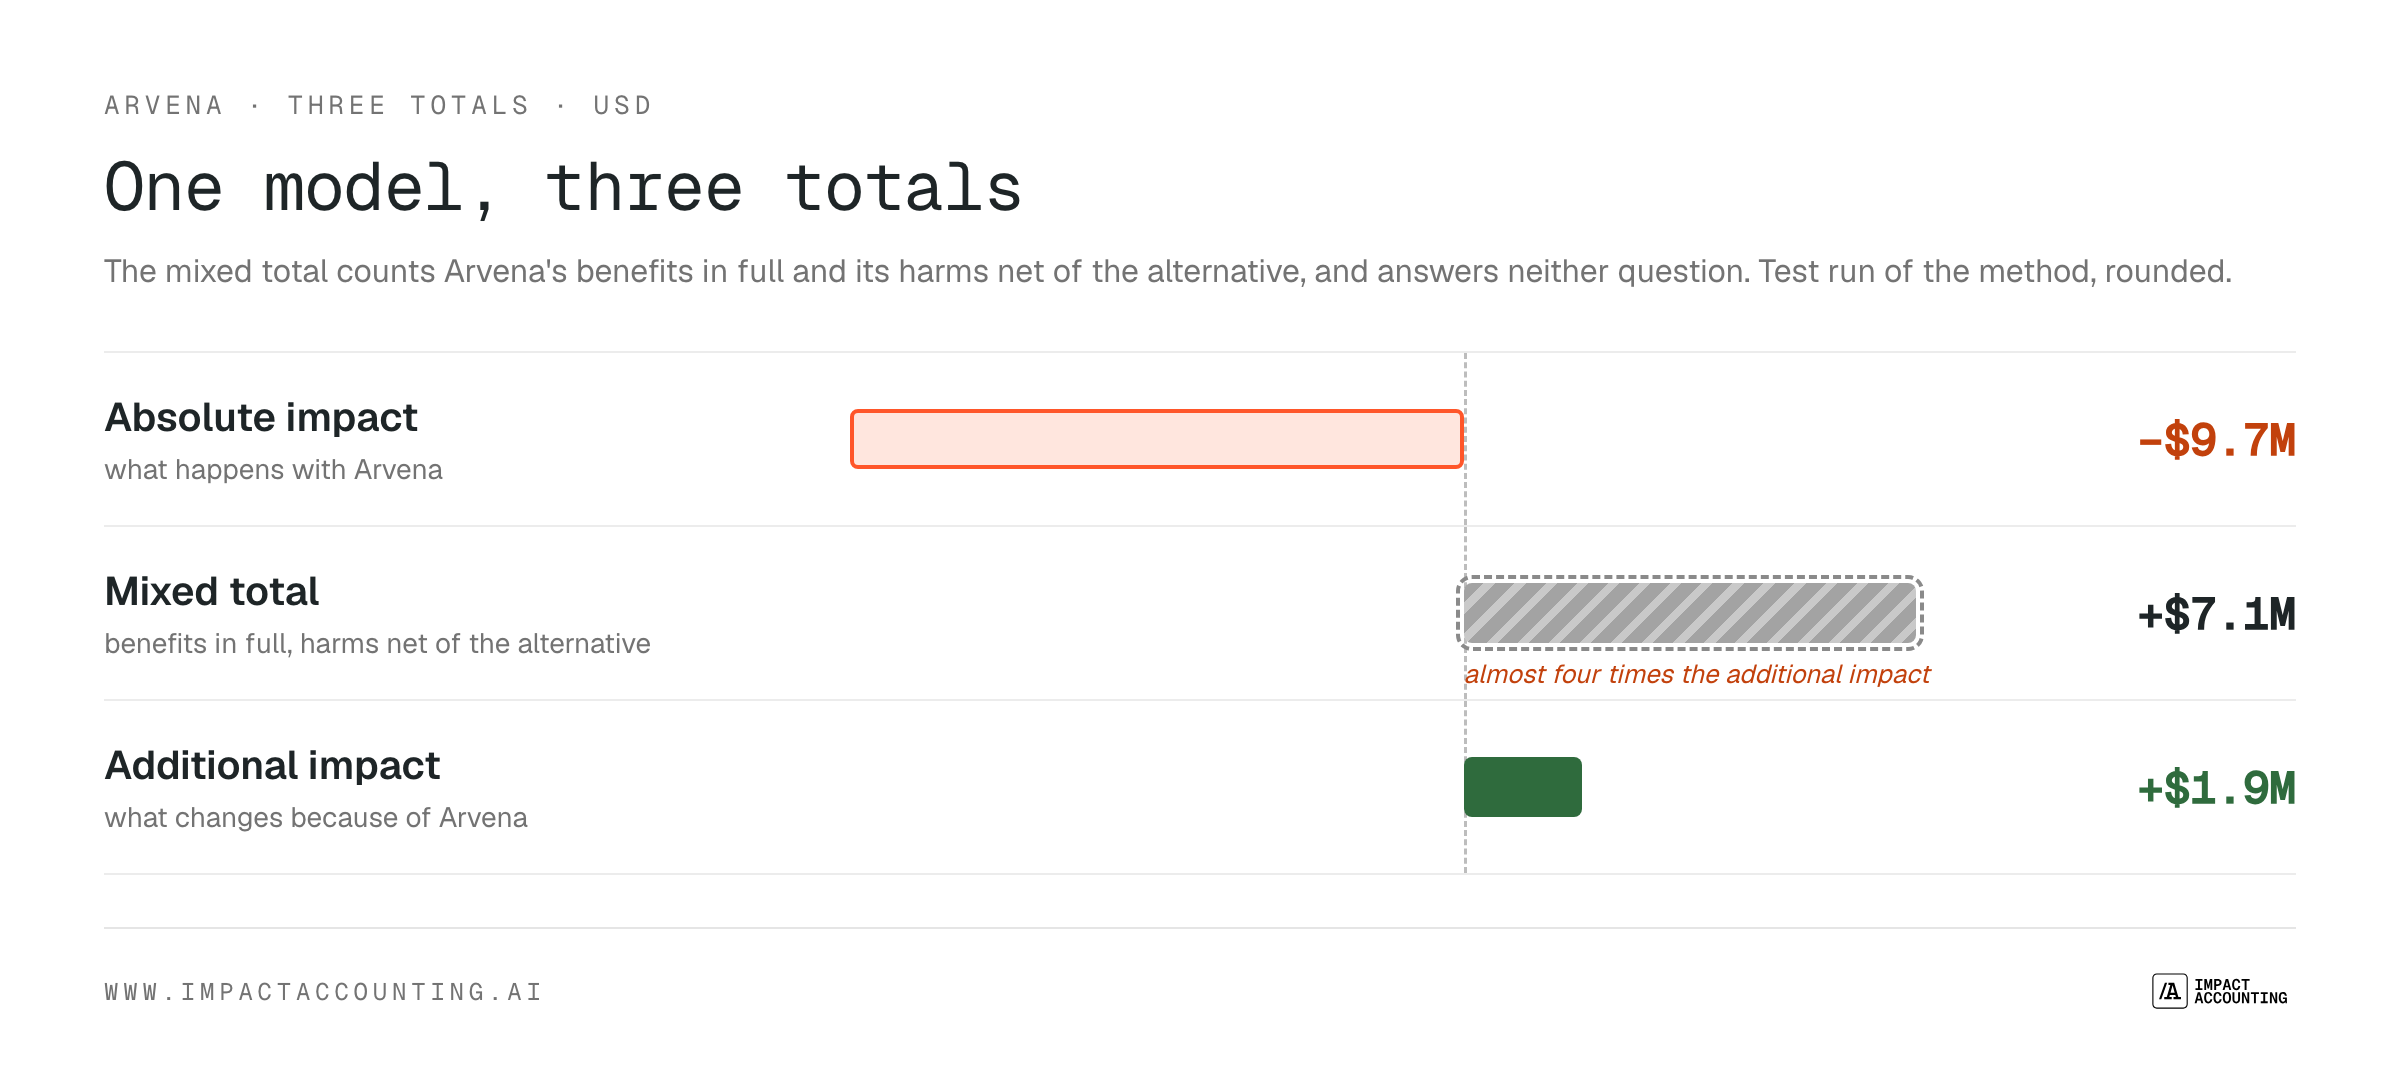
The size of the error is easy to underestimate. In the example below, that mixed total comes to about +$7 million, almost four times the additional impact of +$1.9 million, and clearly positive where the absolute impact is −$9.7 million. A reader would see a strongly positive company where the full account shows a heavy footprint and a modest gain against its alternative.
Closing the circle with the net impact bridge
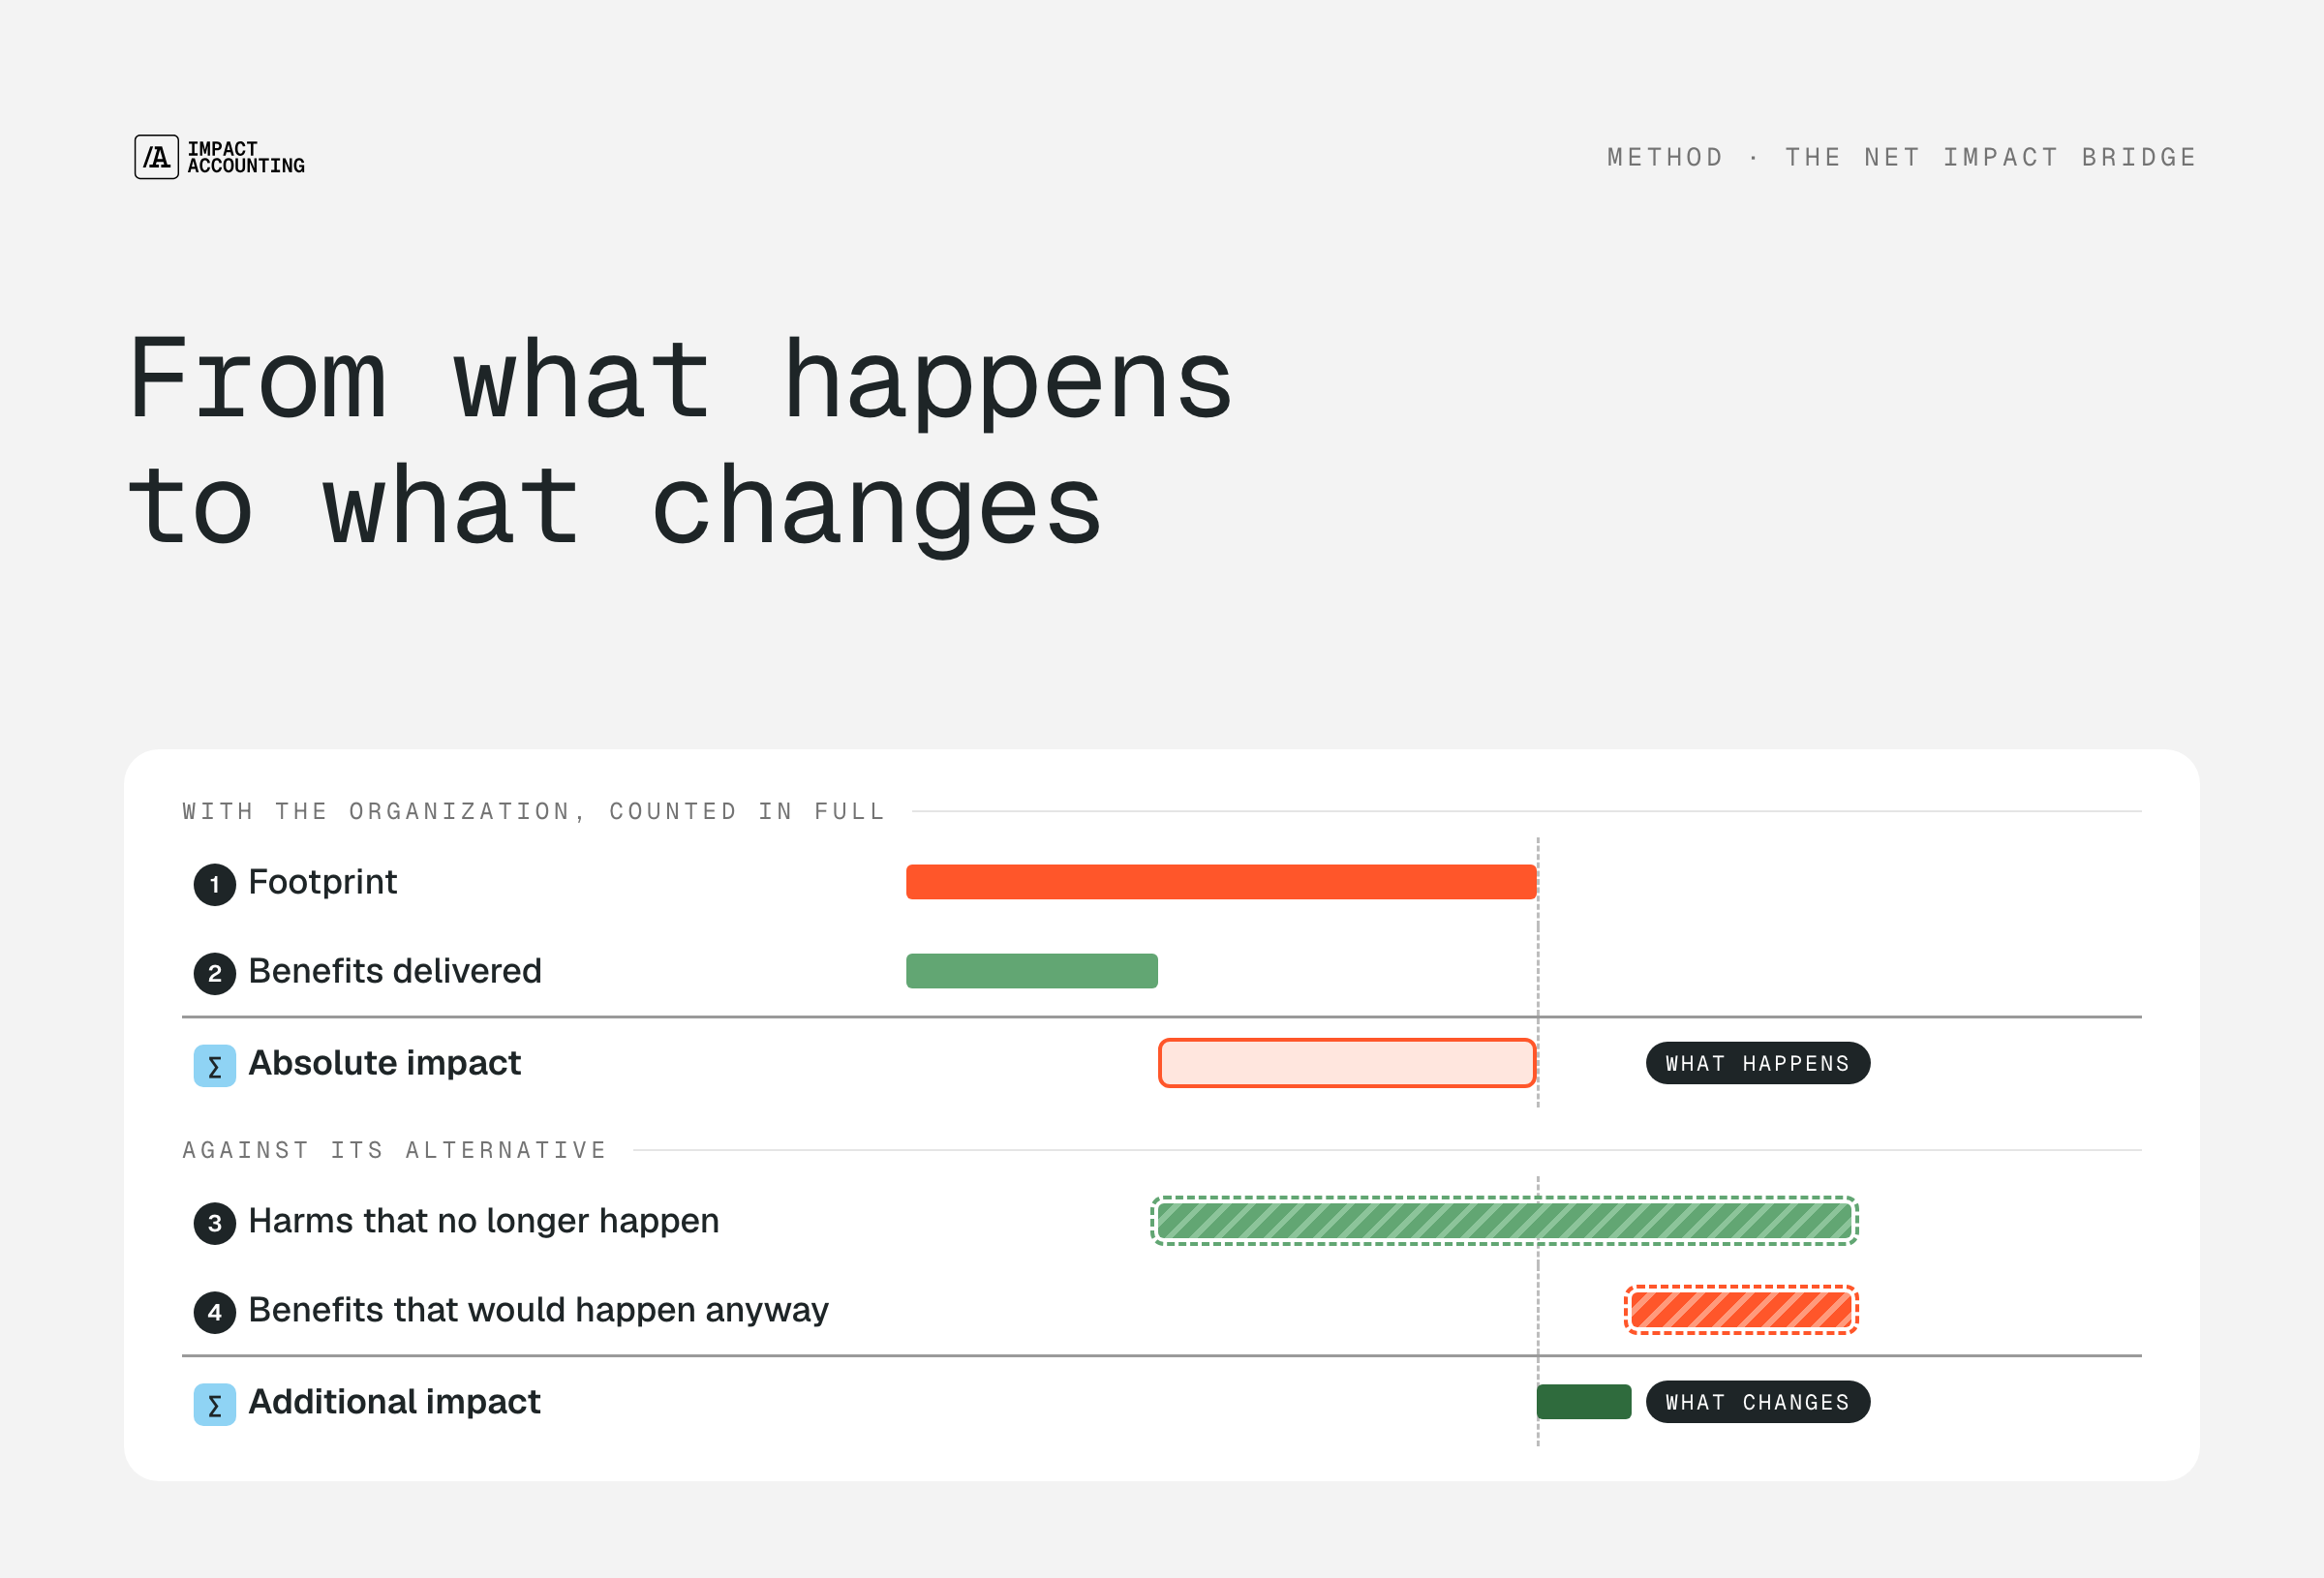
Two separate figures raise a fair question. If the absolute impact is negative and the additional impact positive, where does the difference come from? The net impact bridge answers it in four steps.
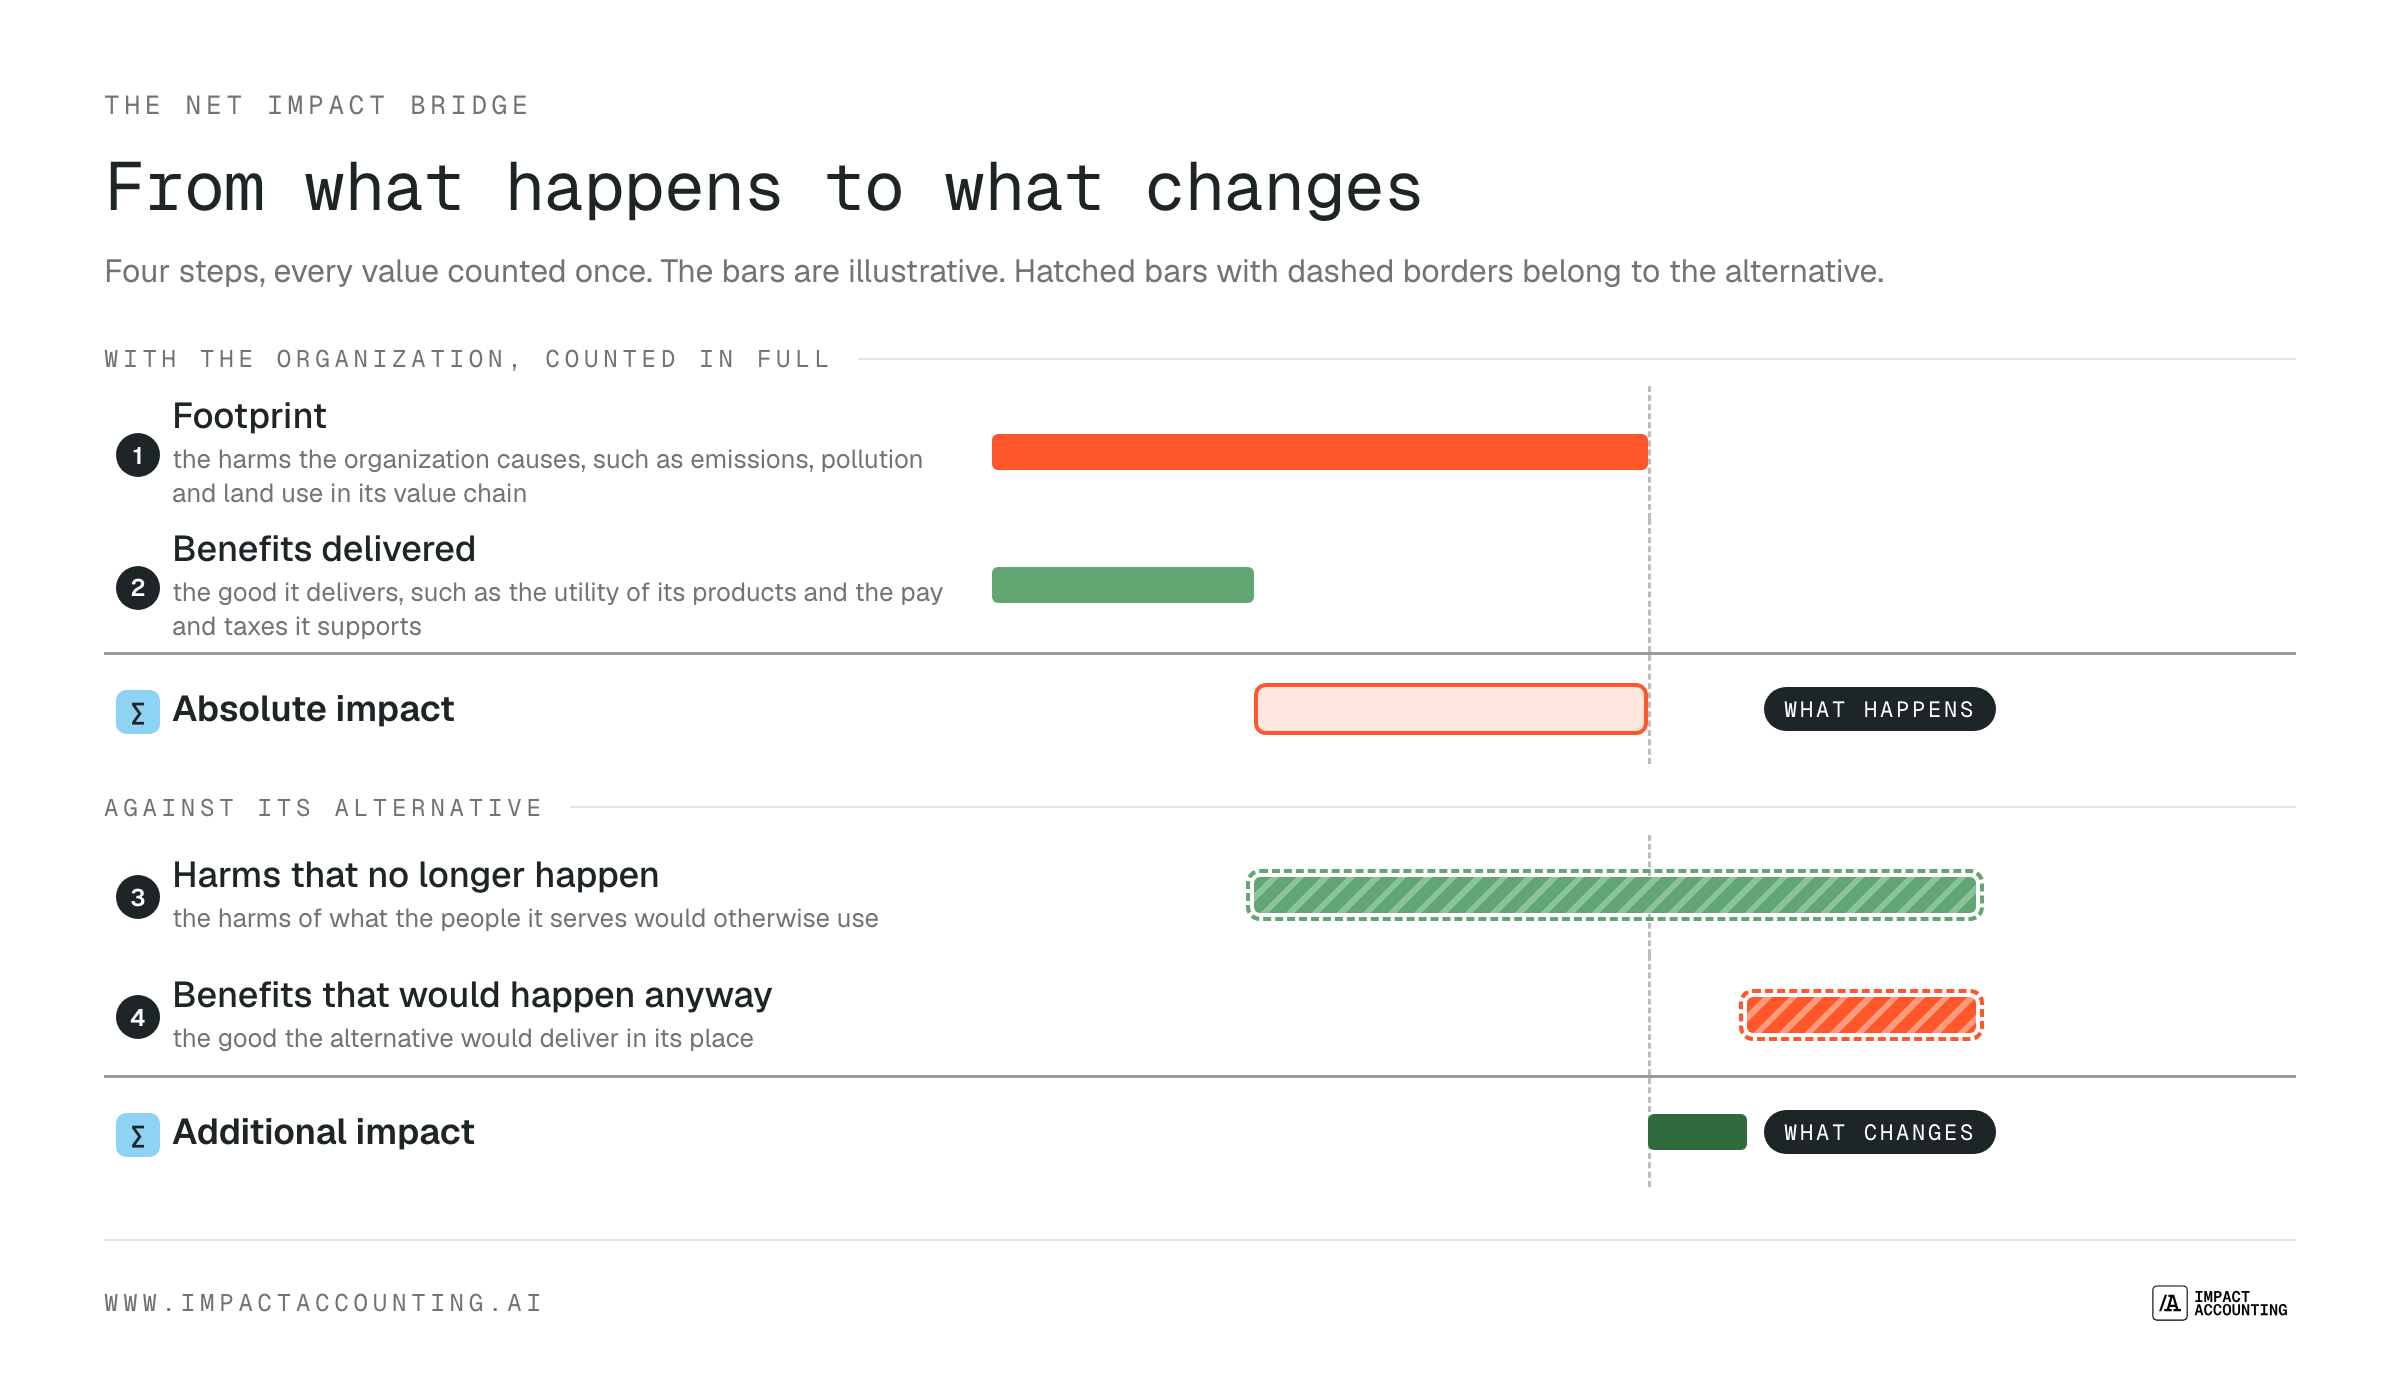
The footprint and the benefits delivered come first. They are counted in full, with no counterfactual and no additionality share, because they describe what happens with the organization, and together they give the absolute impact. The harms of the alternative that no longer happen are then added, and the benefits that would happen anyway are subtracted. The result is the additional impact. Every value in the model is counted once and in full, and the two figures reconcile exactly.
Climate accounting already follows half of this logic. Scopes 1, 2 and 3 form the footprint, and the reference scenario behind avoided emissions fills the harms that no longer happen. Climate accounting can stop there because it compares products that deliver the same function, so their benefits cancel out. An impact account values those benefits as well, which is why the bridge adds the positive values on both sides and closes the circle.
The matrix behind the bridge
Each pathway's value in each capital sits in one of four boxes, set by its scenario and its sign, so a harm and a benefit inside one capital of one pathway are already netted. The top row holds what happens with the organization, its footprint and the benefits it delivers, and adds up to the absolute impact. The bottom row holds the alternative, the harms it would cause and the benefits it would deliver, and is subtracted from it.
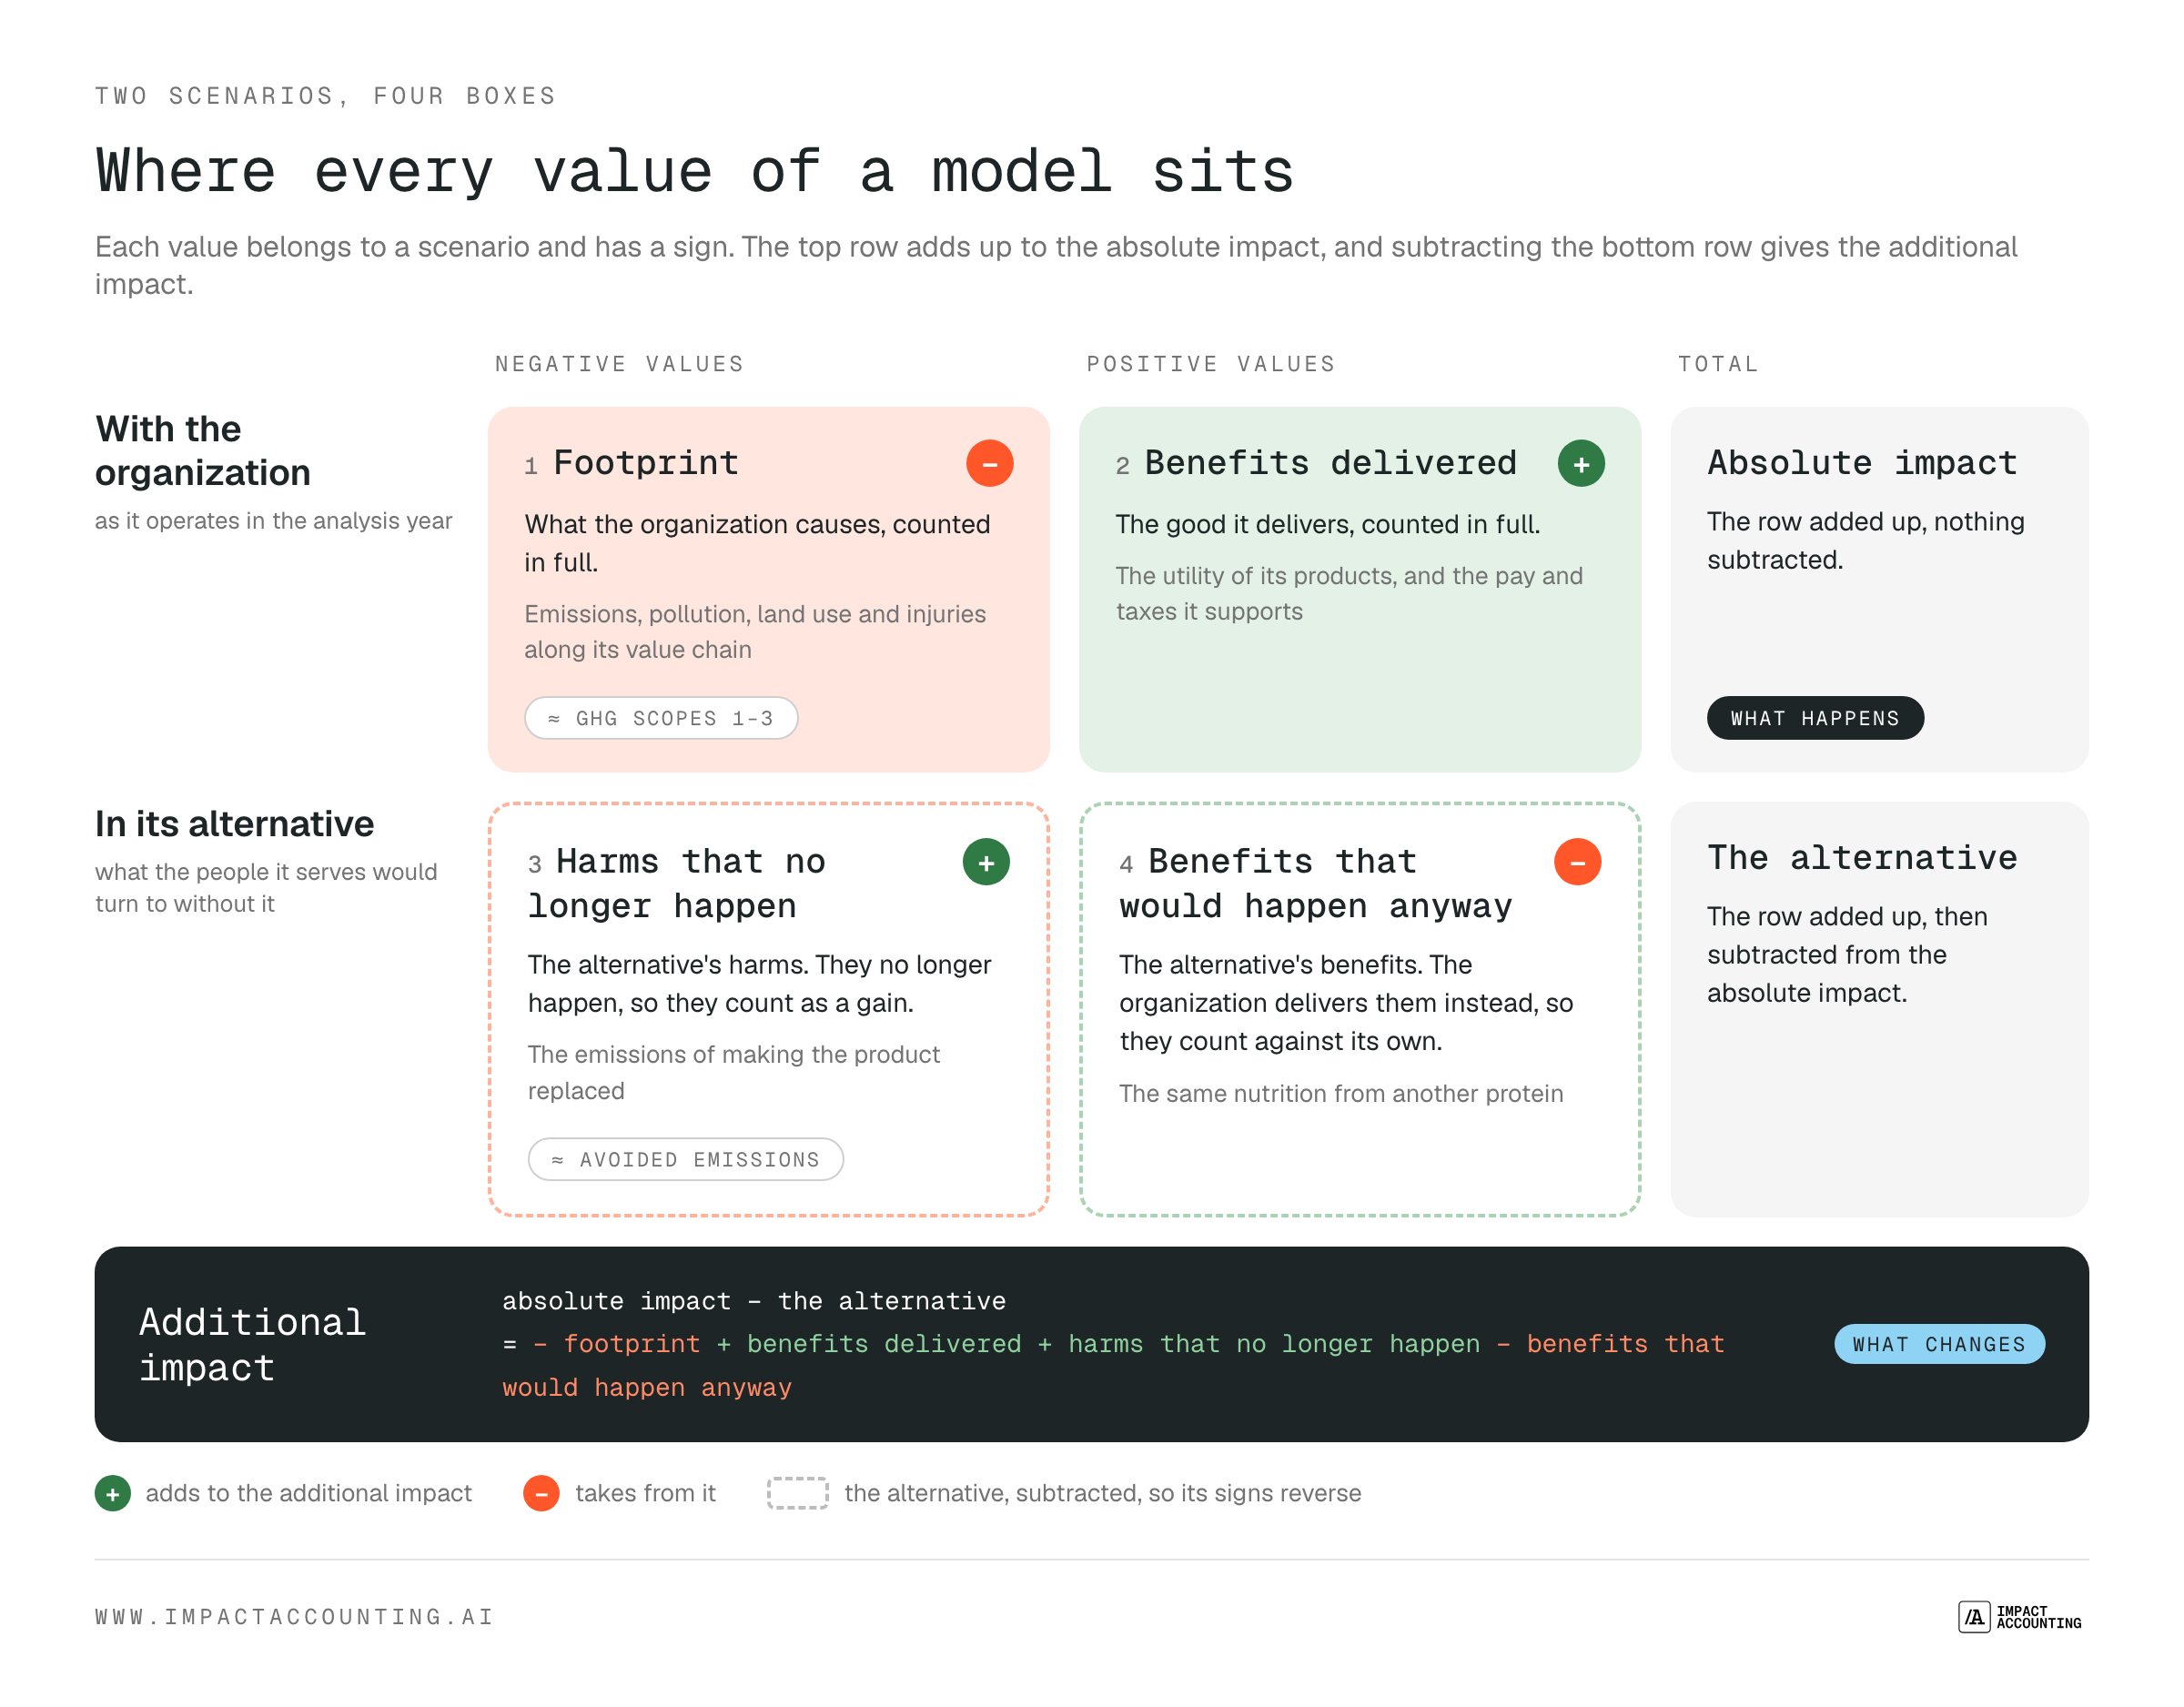
Subtracting the alternative reverses its signs. A negative value of the alternative, such as the emissions of producing the whey a food maker no longer buys, no longer happens, so it counts as a gain. A positive value of the alternative, such as the nutrition that whey would have supplied, is now delivered by the organization instead, so it counts against the organization's own benefits. That is why the bottom row reads as harms that no longer happen and benefits that would happen anyway.
Each pathway also stands against its alternative in one of three ways. Most are net of an alternative, valued in both scenarios, such as the nutrition of a protein that another protein would also supply, so only the difference reaches the additional impact. Some have no alternative, because nothing in the alternative takes their place, such as the dust or refrigerant released at the organization's own site, so they count the same in both figures. Others happen only in the alternative, such as the production of what the organization replaces, and count in the additional impact alone.
An example, Arvena
Arvena, a fictitious name for a company valued in the software, turns a pulse crop into protein, starch and fibre that it sells to food makers. Without it, the food makers would buy a protein mix that is mostly whey, a dairy protein, with some pea and soy protein, and starch and fibre from other suppliers. Consumers eat the same foods in both scenarios, so the alternative stops with the producers of those ingredients. The figures come from a test run of the method on 39 pathways and are rounded.
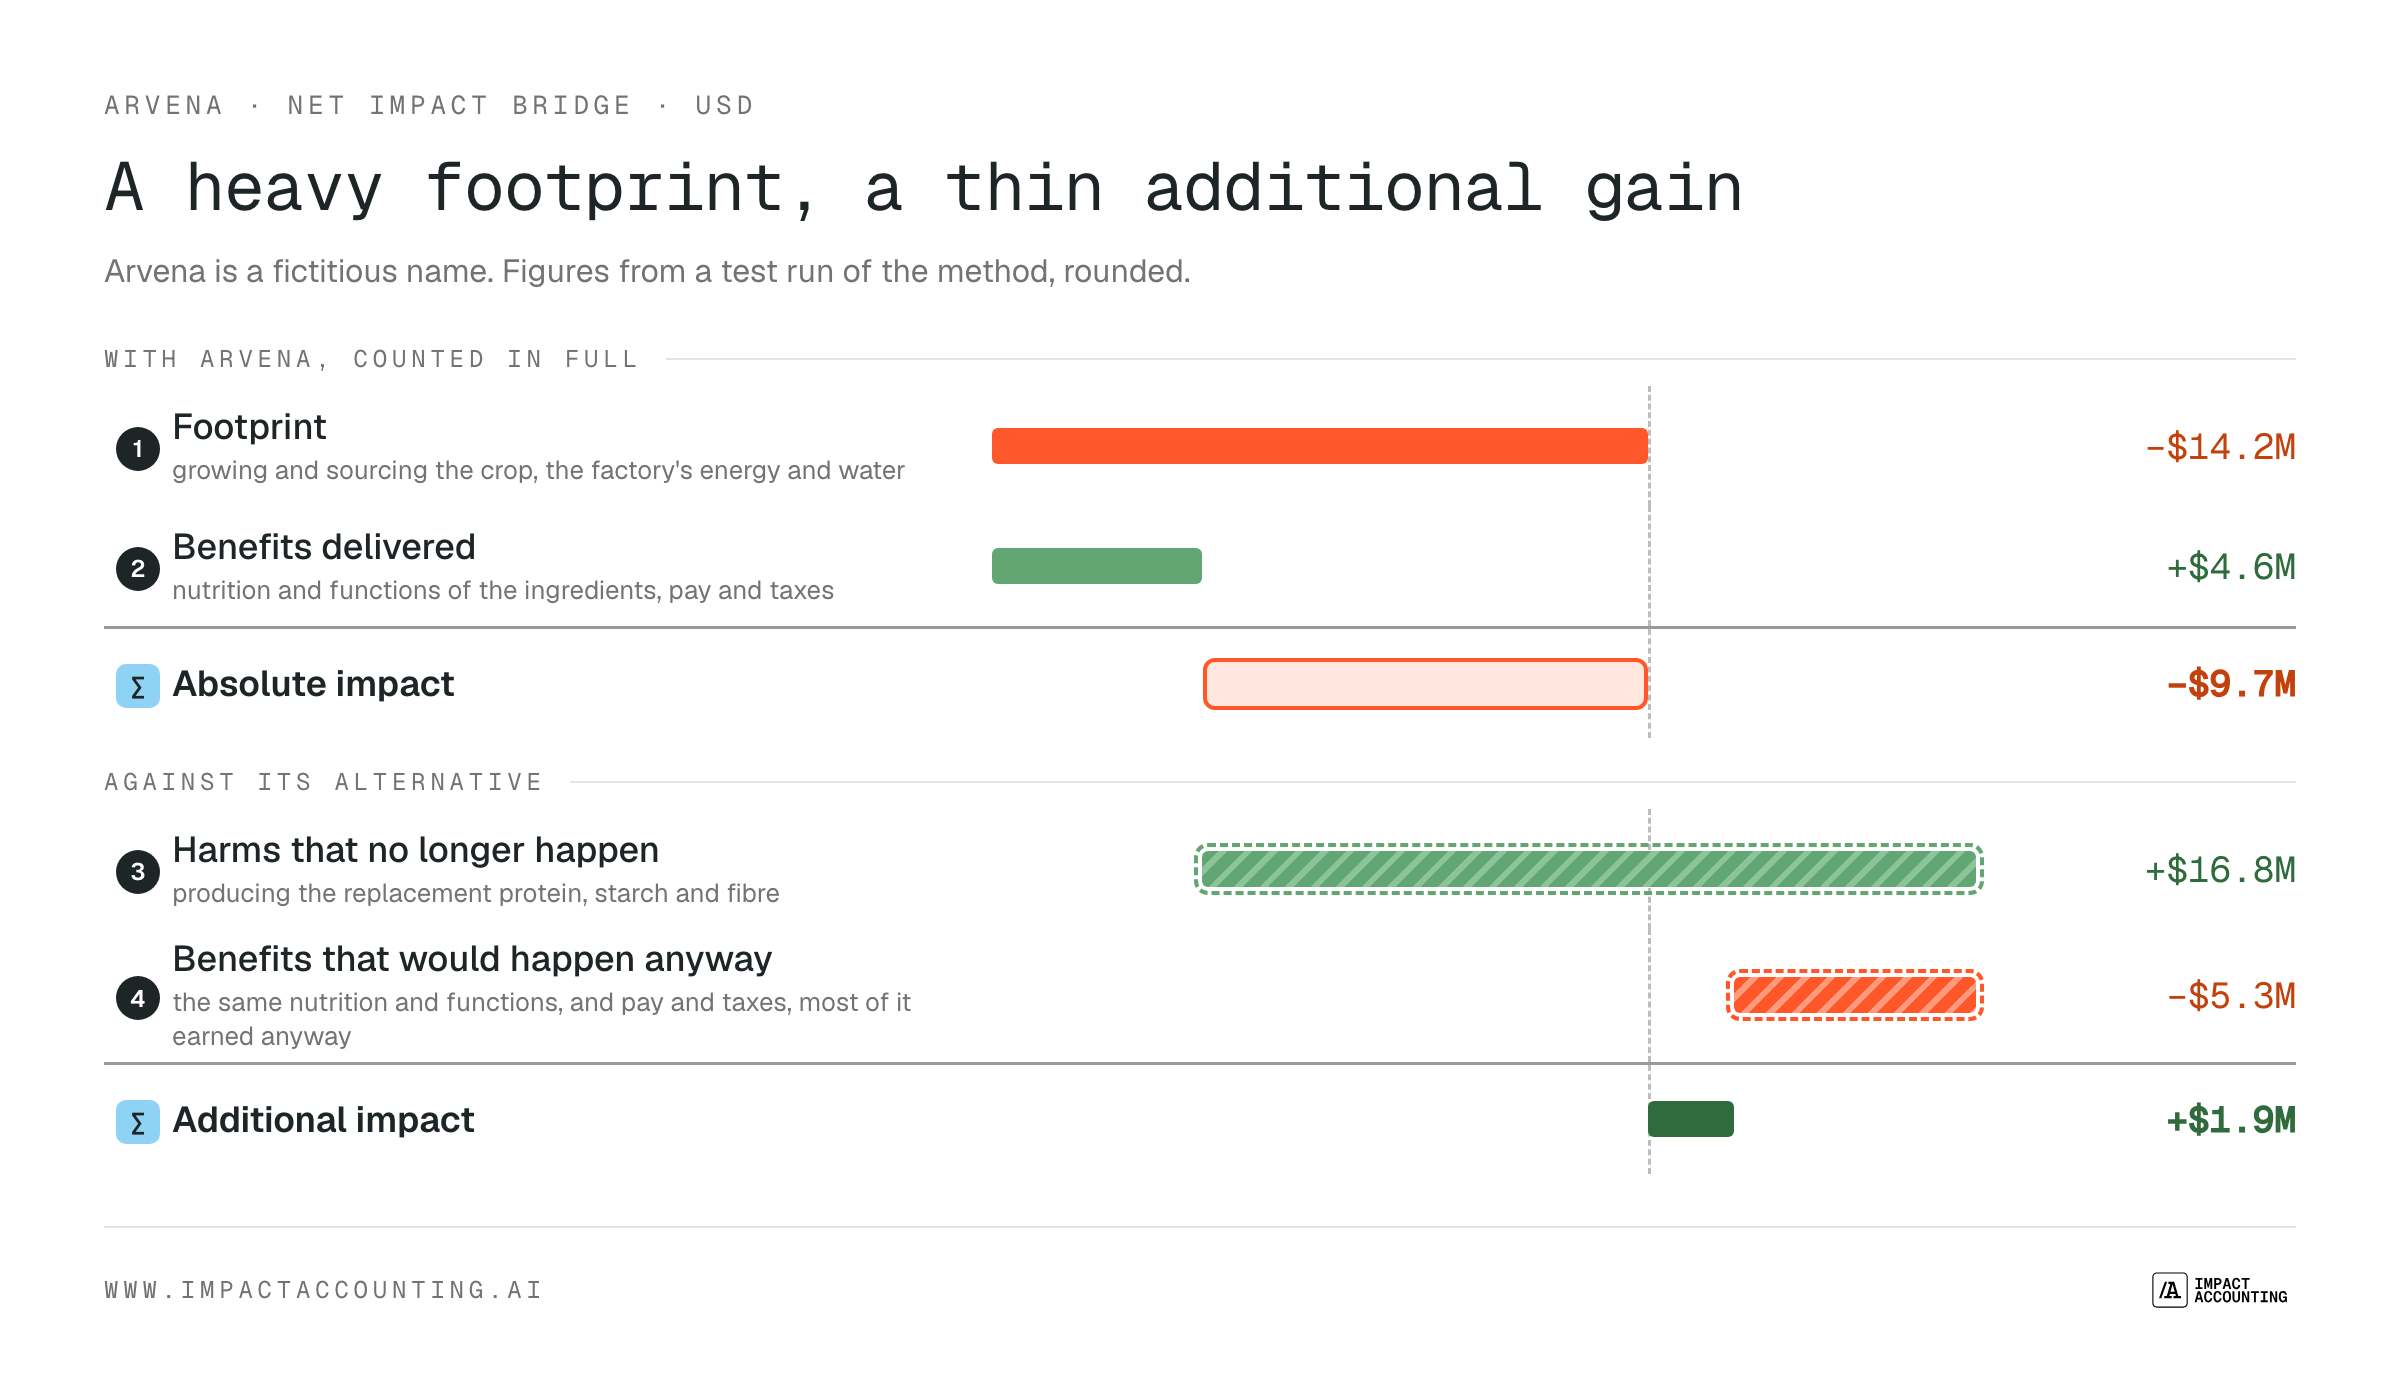
With Arvena, the footprint comes to −$14.2 million, about three times the benefits delivered. Most of it comes from growing and sourcing the crop, and much of the rest from the factory's energy and water. The benefits delivered add up to +$4.6 million, from the nutrition and functions of the ingredients and the pay and taxes that Arvena's operations and purchases support. The absolute impact is therefore −$9.7 million.
In the alternative, producing the replacement protein, starch and fibre would cause $16.8 million of harms, which no longer happen. The alternative would also deliver $5.3 million of benefits, the same nutrition and functions and more pay and taxes than Arvena's supply chain, although most of the workers involved would be employed anyway. The additional impact is +$1.9 million.
| Selected pathways of Arvena | Against the alternative | Absolute | Additional |
|---|---|---|---|
| Replacement protein production | Alternative only | none | +$12.2M |
| Crop cultivation and sourcing | Net of an alternative | −$9.2M | −$10.5M |
| Replacement starch and fibre | Alternative only | none | +$2.9M |
| Factory electricity use | Net of an alternative | −$1.3M | −$1.4M |
| Protein nutrition | Net of an alternative | +$0.92M | $0 |
| Payroll taxes and contributions | Net of an alternative | +$0.65M | +$0.06M |
| Starch and fibre functions | Net of an alternative | +$0.53M | $0 |
| Ingredient and residue freight | Net of an alternative | −$0.37M | −$0.63M |
| All 39 pathways | −$9.7M | +$1.9M |
The three ways a pathway stands against its alternative explain most of the result. Producing the replacement protein happens only in the alternative and is the largest gain in the additional impact. Growing and sourcing the crop is the largest cost, and its additional value is even more negative than its absolute value, because the absolute value includes the pay and taxes Arvena's purchases support and most of those workers would be employed anyway. The utility of the ingredients, meaning the nutrition of the protein and the functions of the starch and fibre, shows why Arvena exists and adds nothing to the additional impact, because the replacement ingredients deliver the same.
The bridge brings out three things that a single figure would hide. Arvena has a heavy footprint, and nothing in its additional impact says otherwise. Its additional impact is positive because the ingredients it replaces have an even heavier footprint, and that difference is larger than its whole additional impact, while most of the good its ingredients do would happen anyway. And the margin is thin. A change of about a tenth in the alternative's harms, from better data on whey production or a different protein mix, would cancel the additional impact, and so would an error of a similar size in Arvena's own footprint. The data plan therefore starts with the production data of the replacement ingredients and the evidence for the protein mix.
One convention matters more than the others. Whey is a co-product of cheese, and its footprint depends on how a dairy's footprint is shared between the two. Both scenarios use average data and the same allocation convention, which keeps the comparison fair. A strictly consequential reading could find that lower demand for whey avoids little dairy production, which would shrink the harms that no longer happen and could reverse the sign of the additional impact. A result that depends on a co-product in this way should state its convention and show how it changes under the other reading before it supports a decision.
The multiples show the same contrast. Divided by Arvena's sales, the additional impact gives an SROI (additional) of 0.18, while the absolute impact gives an SROI (absolute) of −0.95. The bridge splits the SROI (additional) into its four parts, −1.41 from the footprint, +0.45 from the benefits delivered, +1.66 from the harms that no longer happen and −0.52 from the benefits that would happen anyway. Arvena's own harms and the larger harms it avoids are both well above one dollar per dollar of sales, while the multiple itself is much smaller, so a reader can see that this small positive multiple is less certain than the same multiple built from Arvena's own benefits.
Three patterns the bridge reveals
Read together, the two figures fall into a few recognisable patterns. Two of the examples below come from test runs of the method on other organizations, with rounded figures, before suppliers' workers employed anyway were taken into account; with them, the climbing gym's additional impact falls from +$48,000 to +$20,000 and its absolute impact does not change. The third is an illustration.
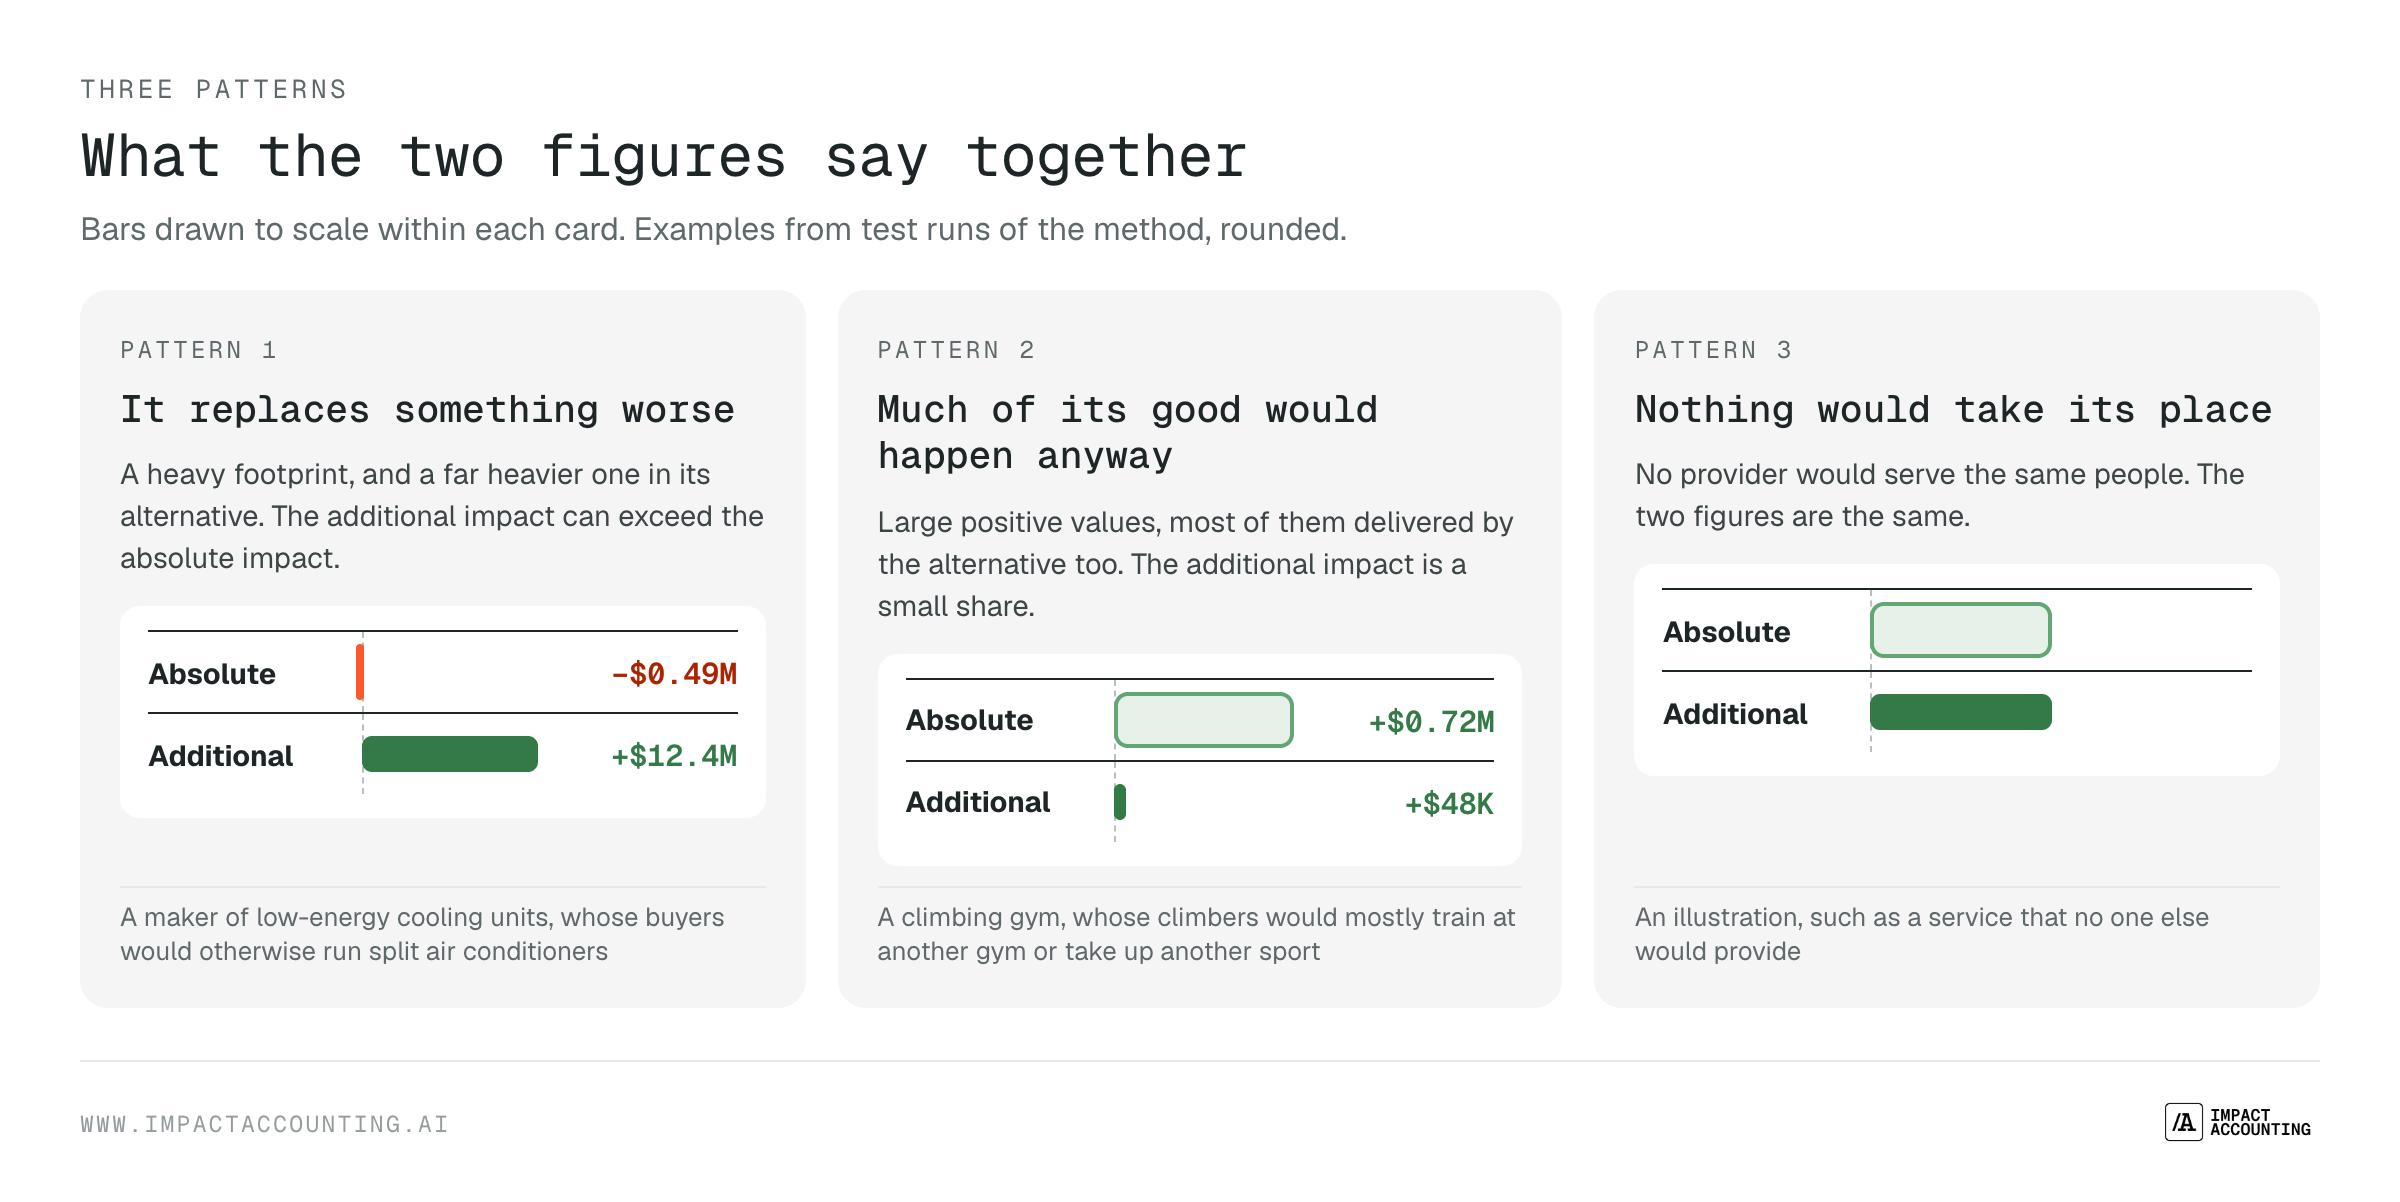
The first pattern is an organization that replaces something worse. A maker of low-energy cooling units has an absolute impact of −$0.49 million, because its units still use electricity and materials. Its buyers would otherwise run split air conditioners that use several times more electricity and leak refrigerant, so its additional impact is +$12.4 million, far above its absolute impact. Arvena follows the same pattern with a much thinner margin.
The second is an organization whose good would largely happen anyway. A climbing gym has an absolute impact of +$0.72 million, mostly the health and enjoyment of its climbers. Most of them would otherwise climb at another gym or take up another sport, so its additional impact is +$48,000. The gym still does a lot of good, and the bridge shows that most of it does not depend on this particular gym.
The third is an organization that nothing would replace. When nothing would happen anyway on any of its pathways, the alternative is empty and the two figures are the same. Having no other provider is not enough on its own, because staff and suppliers' workers may still find work elsewhere. This is rarer than accounts that skip the alternative suggest, and it is a finding to document, not a default to assume. Most real organizations mix the three patterns across their pathways, and the Model shows which pathway follows which.
What changes for users
Readers get two figures that each mean one thing. The absolute impact goes into impact statements and sustainability reporting, where the question is what happens. The additional impact goes into investment decisions, the SROI (additional) and comparisons across a portfolio, where the question is what changes. Each figure comes with its multiples, SROI (additional) and SROI (absolute), and over a scenario's years IMOIC (additional) and IMOIC (absolute). Neither has to be stretched or footnoted to stand in for the other.
The Model shows both without adding clutter. The bridge sits above the results with a switch for three views. Summary, the default, reads the absolute impact alone. Alternative adds the additional impact, drawn as a solid bar inside the outline of the absolute one. Four steps shows every step of the bridge as a column, so the total row repeats the bridge and each pathway shows where its additional impact comes from. Rows can also be grouped by how they stand against their alternative.
Experts who calibrate a model change the alternative itself rather than a percentage. The brief records what the people served would turn to and in what shares, and each pathway states its alternative in words. A disagreement about additionality becomes a discussion about a concrete scenario, which is much easier to settle with evidence.
The insights improve as well. A negative absolute impact next to a positive additional impact is no longer a contradiction to explain away. It is a finding with a visible source. The bridge shows whether an organization's case rests on its own benefits or on what it replaces, how thin the margin is, and which data would move it most. Data on the organization's own footprint moves both figures by the same amount, while data on the alternative moves only the additional impact. Across a portfolio, the additional impact compares organizations on the same basis, while the absolute impact keeps each one's footprint in view.
Questions readers ask
Is the additional impact always smaller than the absolute impact?
No. It is larger whenever the alternative's harms outweigh its benefits, as with the cooling-unit maker. It can also be negative while the absolute impact is positive, when the alternative delivers the same good with fewer harms.
Which figure belongs in which report?
Impact statements and sustainability reporting describe the effects an organization causes, so they use the absolute impact. Investment decisions, the SROI and comparisons across a portfolio ask what an organization changes, so they use the additional impact. A report can show both side by side, as long as they are never added and each is labelled with the question it answers.
Where do the alternative's shares come from?
They come from evidence, or from the answers given in the brief where evidence is thin, such as the share of customers who would turn to each competing product. The model keeps every share as an input, so an expert can change it and see the additional impact move.
Why not follow the chain further?
What a supplier's land or plant would produce instead would largely be made somewhere else anyway, and each extra step stacks one uncertain estimate on another. The alternative therefore stops with the provider that would serve the same people. A market reaction enters the model only when the brief names it as part of the impact thesis.
What happens to models built before the change?
A model that records no alternative keeps showing its single value, exactly as before, and its published releases stay as they are. It moves to the new method when it is run again, which is done on demand rather than for every project at once.
In short
The approach replaces a percentage with an alternative that anyone can read and question. It keeps what happens and what changes in two columns that are never added, and it connects them with a bridge in which every value is counted once. Funders get an answer to the question of what would have happened anyway that they can follow line by line, and the experts who build the accounts get a model they can discuss with evidence rather than with conventions.