

Case study
What scrolling really costs you
If you have ever caught yourself scrolling through your feed without really wanting to, you have probably sensed that it is not the best way to treat your brain. So what does that habit cost us? I tried to put a number on one part of it, the effect on our wellbeing.
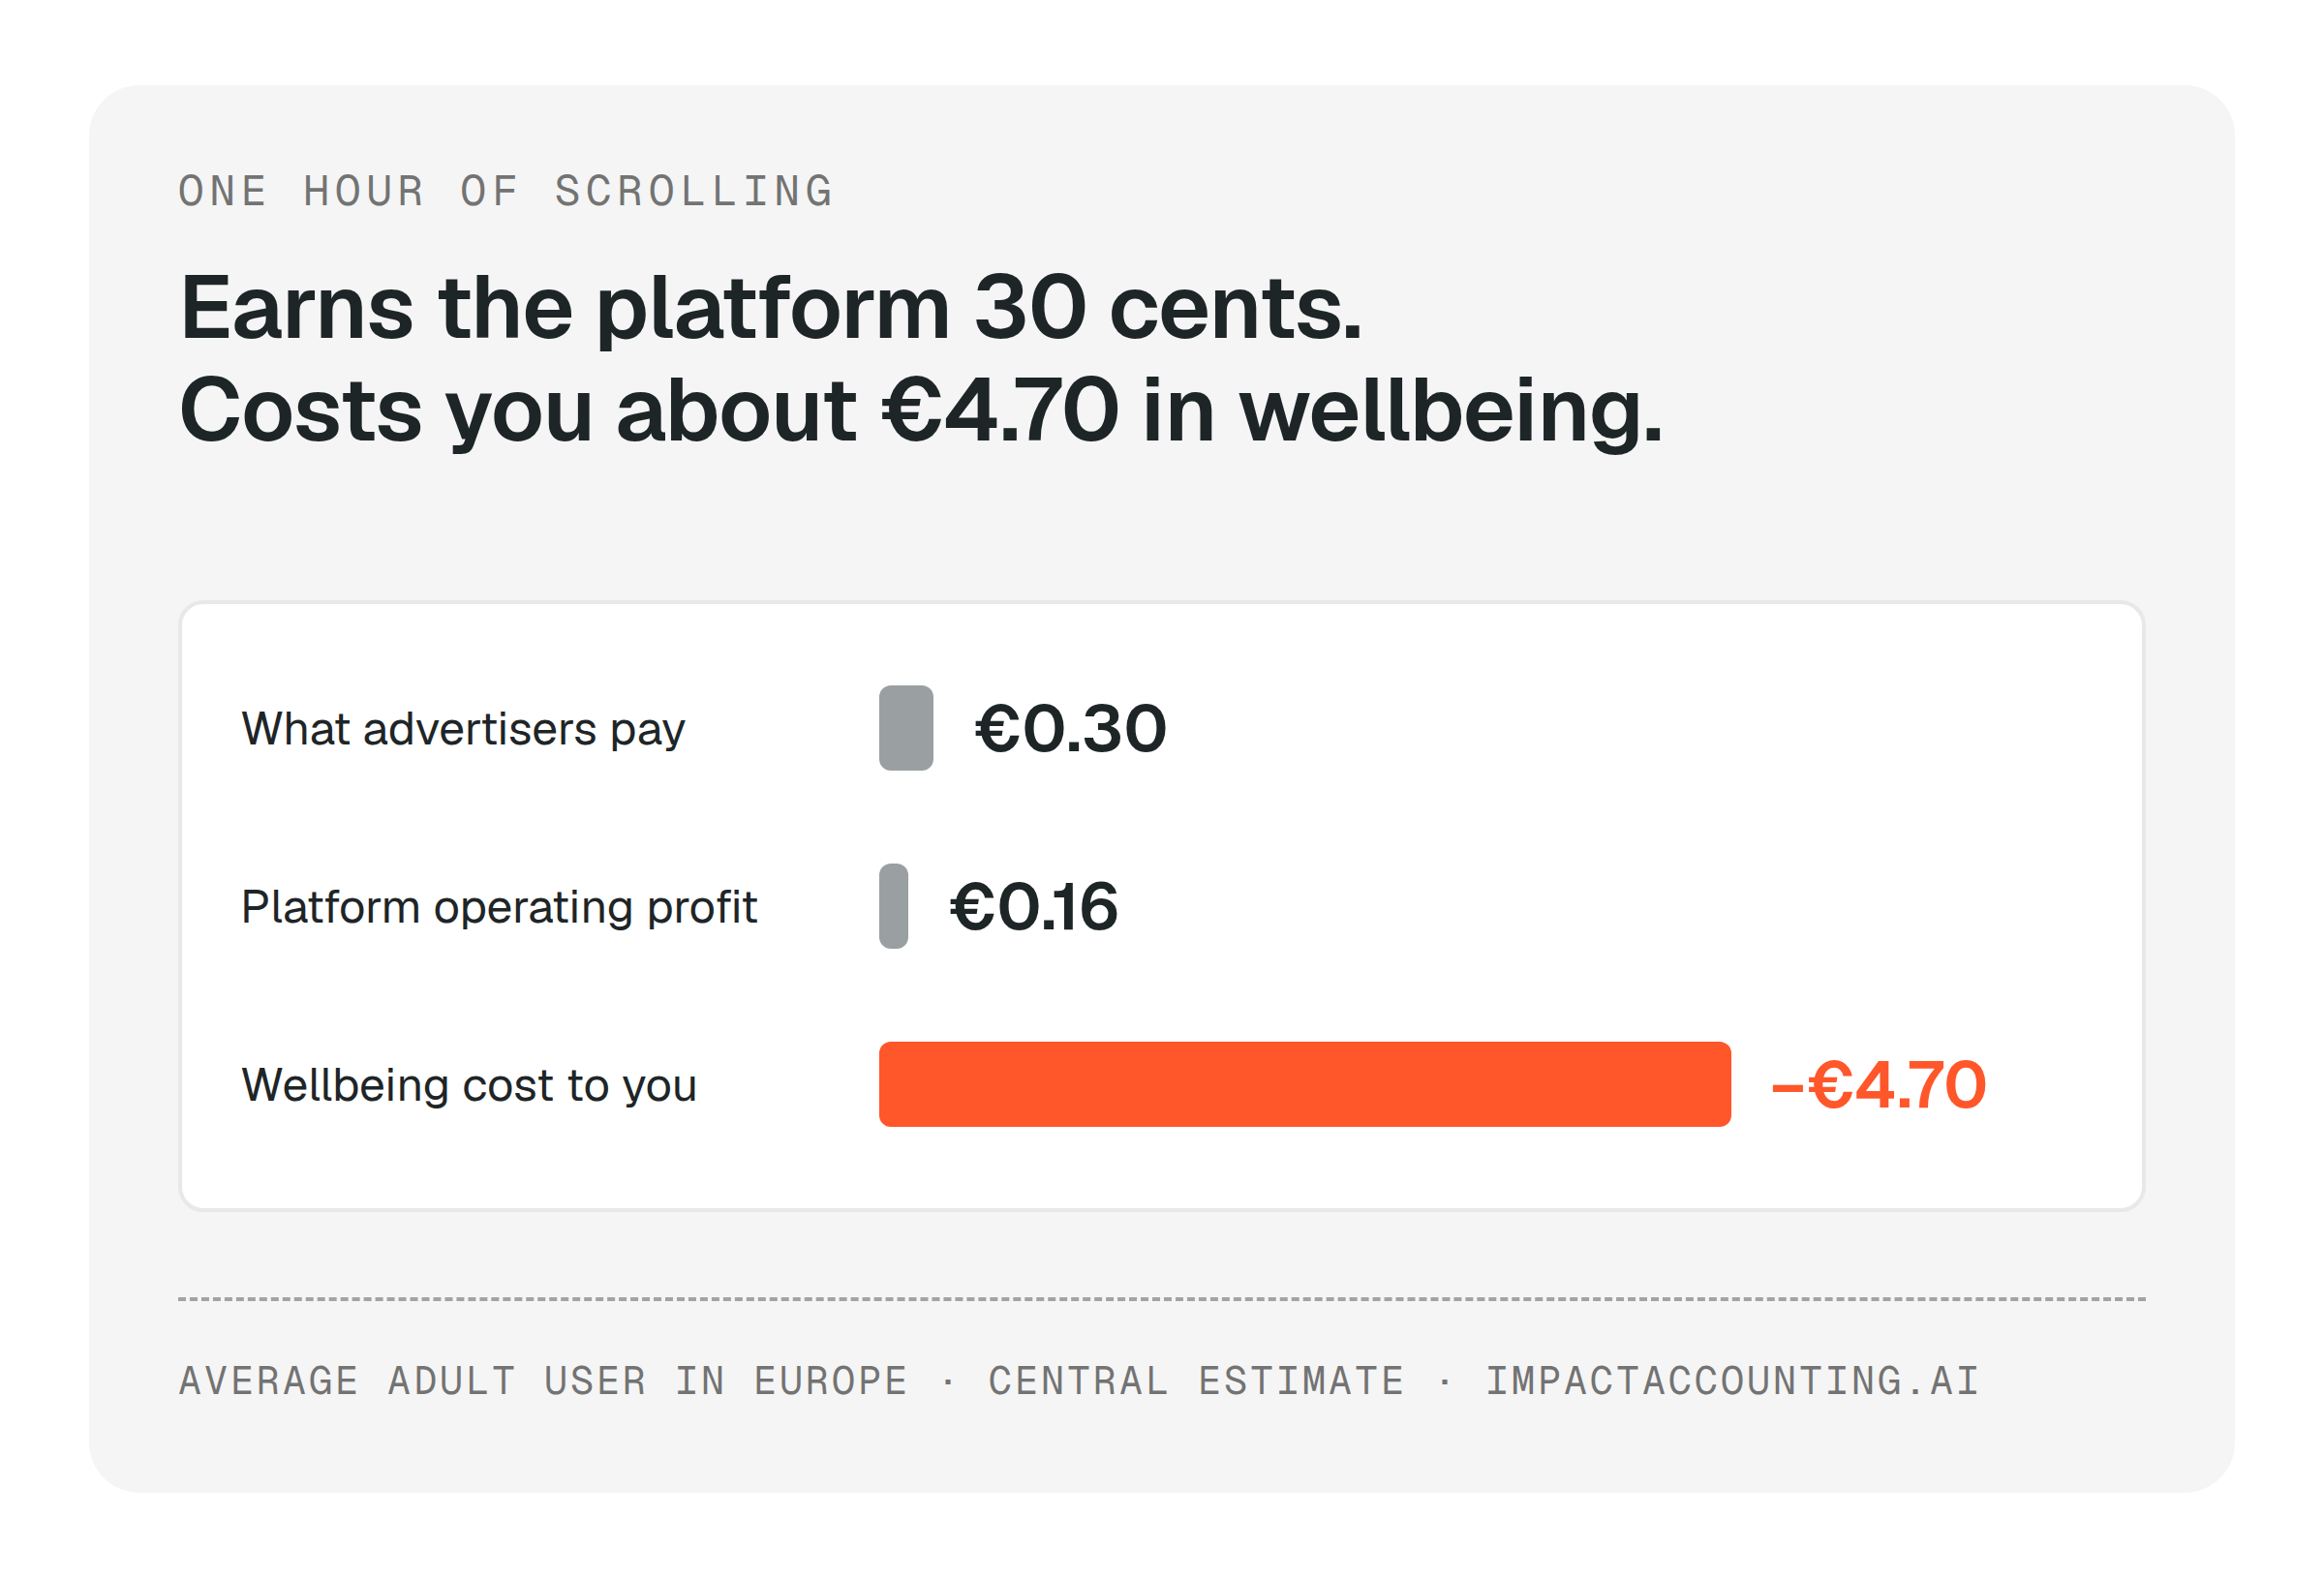
By Pietro Grilli, November 2026
First things first. Before reading on, take your phone, open Settings, go to Screen Time and look at your average over the past few weeks. Better still, check how much of it goes to social media. For the average adult user of Facebook and Instagram in Europe, those two apps alone come to close to six hours a week, about 51 minutes a day, by my estimate from UK tracking data [1, 2]. But you may well spend more than that, as I do (I’m working on it).
The platform knows what those hours are worth. In 2025 Meta, which runs both apps, earned €42.5 billion from users in its Europe region [3], roughly €95 for each person using its apps there, by my estimate. For every hour you spend scrolling, advertisers pay the platform about 30 cents, and about 16 cents of that is operating profit [4].
What the same hour costs the person scrolling is rarely counted. I started thinking about it while reading Yanis Varoufakis’s book Technofeudalism, which argues that digital platforms increasingly set the rules of today’s economy [5]. Over the past few weeks I valued one year of a representative feed platform, calibrated on Facebook and Instagram and covering 269 million adult users in the European Union (EU), the United Kingdom (UK), Norway, Iceland and Switzerland. I used published experiments and impactaccounting.ai, our impact valuation software.
The valuation follows one pathway, the effect of feed use on users’ wellbeing, plus what the platform earns from it. It is not a full impact statement of the platform. So when the title asks what scrolling really costs you, the answer here is the wellbeing part of the bill, not the whole of it. My central estimate is that each hour costs the average user about 45 minutes of healthy life. Monetised, that is about €4.70, more than 15 times what advertisers pay for the hour.
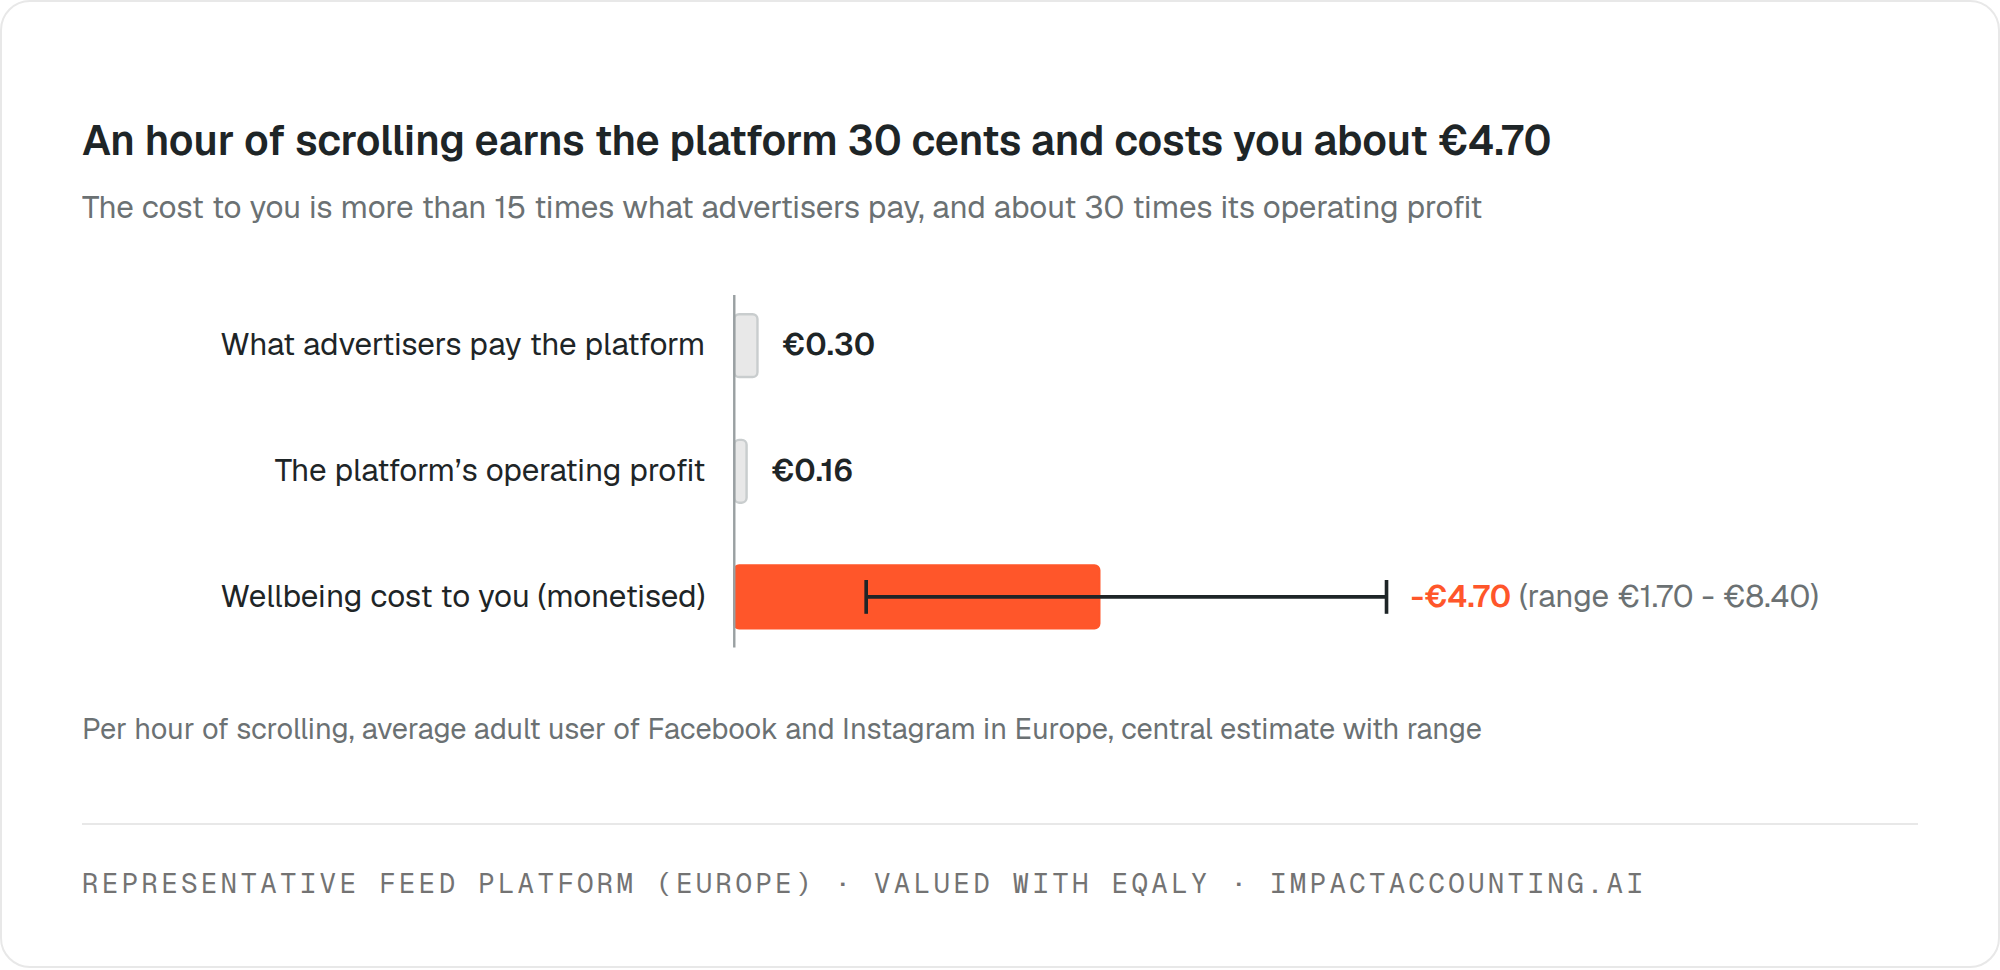
Source: impactaccounting.ai model R0, central case and range [17]; Meta 2025 results [3, 4]; converted at 1.13 USD per EUR [34]
People value it (but they feel better without it)
The most convincing evidence comes from economists who did something rather simple. They paid people to quit. In 2018, Hunt Allcott, Matthew Gentzkow and colleagues asked American Facebook users how much money they would want to switch it off for four weeks. The typical answer was USD 100 [6]. Then they paid some of them to actually do it. The quitters gained about an hour a day, spent more of it with friends and family, and reported higher life satisfaction and less anxiety and depression [6].
When the same researchers repeated the experiment in 2020 with about 35,000 people, the result pointed the same way for Facebook, and less clearly for Instagram [7]. Most of the freed time simply went to other apps, and people still felt better [7].
A fair warning, though. That first experiment is now eight years old, it was run in the United States (US), and social media has changed a lot since. Our feeds are now shaped far less by what our friends post and far more by what the algorithm thinks will keep us watching, from short videos to endless recommendations from accounts we never followed. And Instagram, not Facebook, is where the action is now, especially for younger people. In the EU, Instagram’s audience grew by about a fifth between 2022 and 2026, while Facebook’s barely moved [8, 9]. My guess is that the habit these researchers measured has become harder to break, not easier.
So why would anyone ask for money to give up something that makes them feel worse? Part of the answer is that feeds are hard to put down. In a separate study, Allcott, Gentzkow and Lena Song estimated that about 31% of our time on social media comes from self-control problems, time we would rather not have spent [10]. The other part is the fear of being left out. So much of our social life now happens behind a screen, from group chats to party invites to simply knowing what our friends are up to, that nobody wants to be the one who leaves. In a study of US college students, Leonardo Bursztyn and colleagues found exactly that. On average, students wanted about USD 47 to quit Instagram alone, yet in a hypothetical campus-wide switch-off they would on average have paid to see it gone for everyone, and 57% of Instagram users said they would prefer a world without it [11, 12].
And leaving is harder than it looks, because these platforms also keep our memories: years of photos, videos and conversations, often the only copy we have. The platforms do offer a download tool, as EU data protection law requires, but what you get back is a heap of files that is hard to make sense of. Some photos and posts can be moved to a handful of other services, but your friends, their comments and your network stay behind. In practice, our digital lives stay where the platform put them.
45 minutes for every hour
Turning a worse mood into a cost needs one extra step. I translated the trial results into life satisfaction, and life satisfaction into equivalent quality-adjusted life years (eQALYs), close to the unit health economists use to compare treatments. I anchored the conversion on European data and cross-checked it against the UK Treasury’s own values [13-16].
The result? For the average adult user in Europe, each hour of scrolling costs about 45 minutes of life in full health (16 - 80 minutes between my low and high assumptions), or about €4.70 (€1.70 - 8.40). At close to six hours a week, that is about 4.4 hours of healthy life lost every week. Scale it up to 269 million users and you get about 7 million healthy life years a year, a societal value of roughly €388 billion [17].
One point on what kind of number this is. It comes from experiments where people were paid to quit, and part of their freed time simply went to other apps. So the 45 minutes are the additional effect of the feed compared with what people would otherwise do with that hour, not the absolute effect of being on a phone.
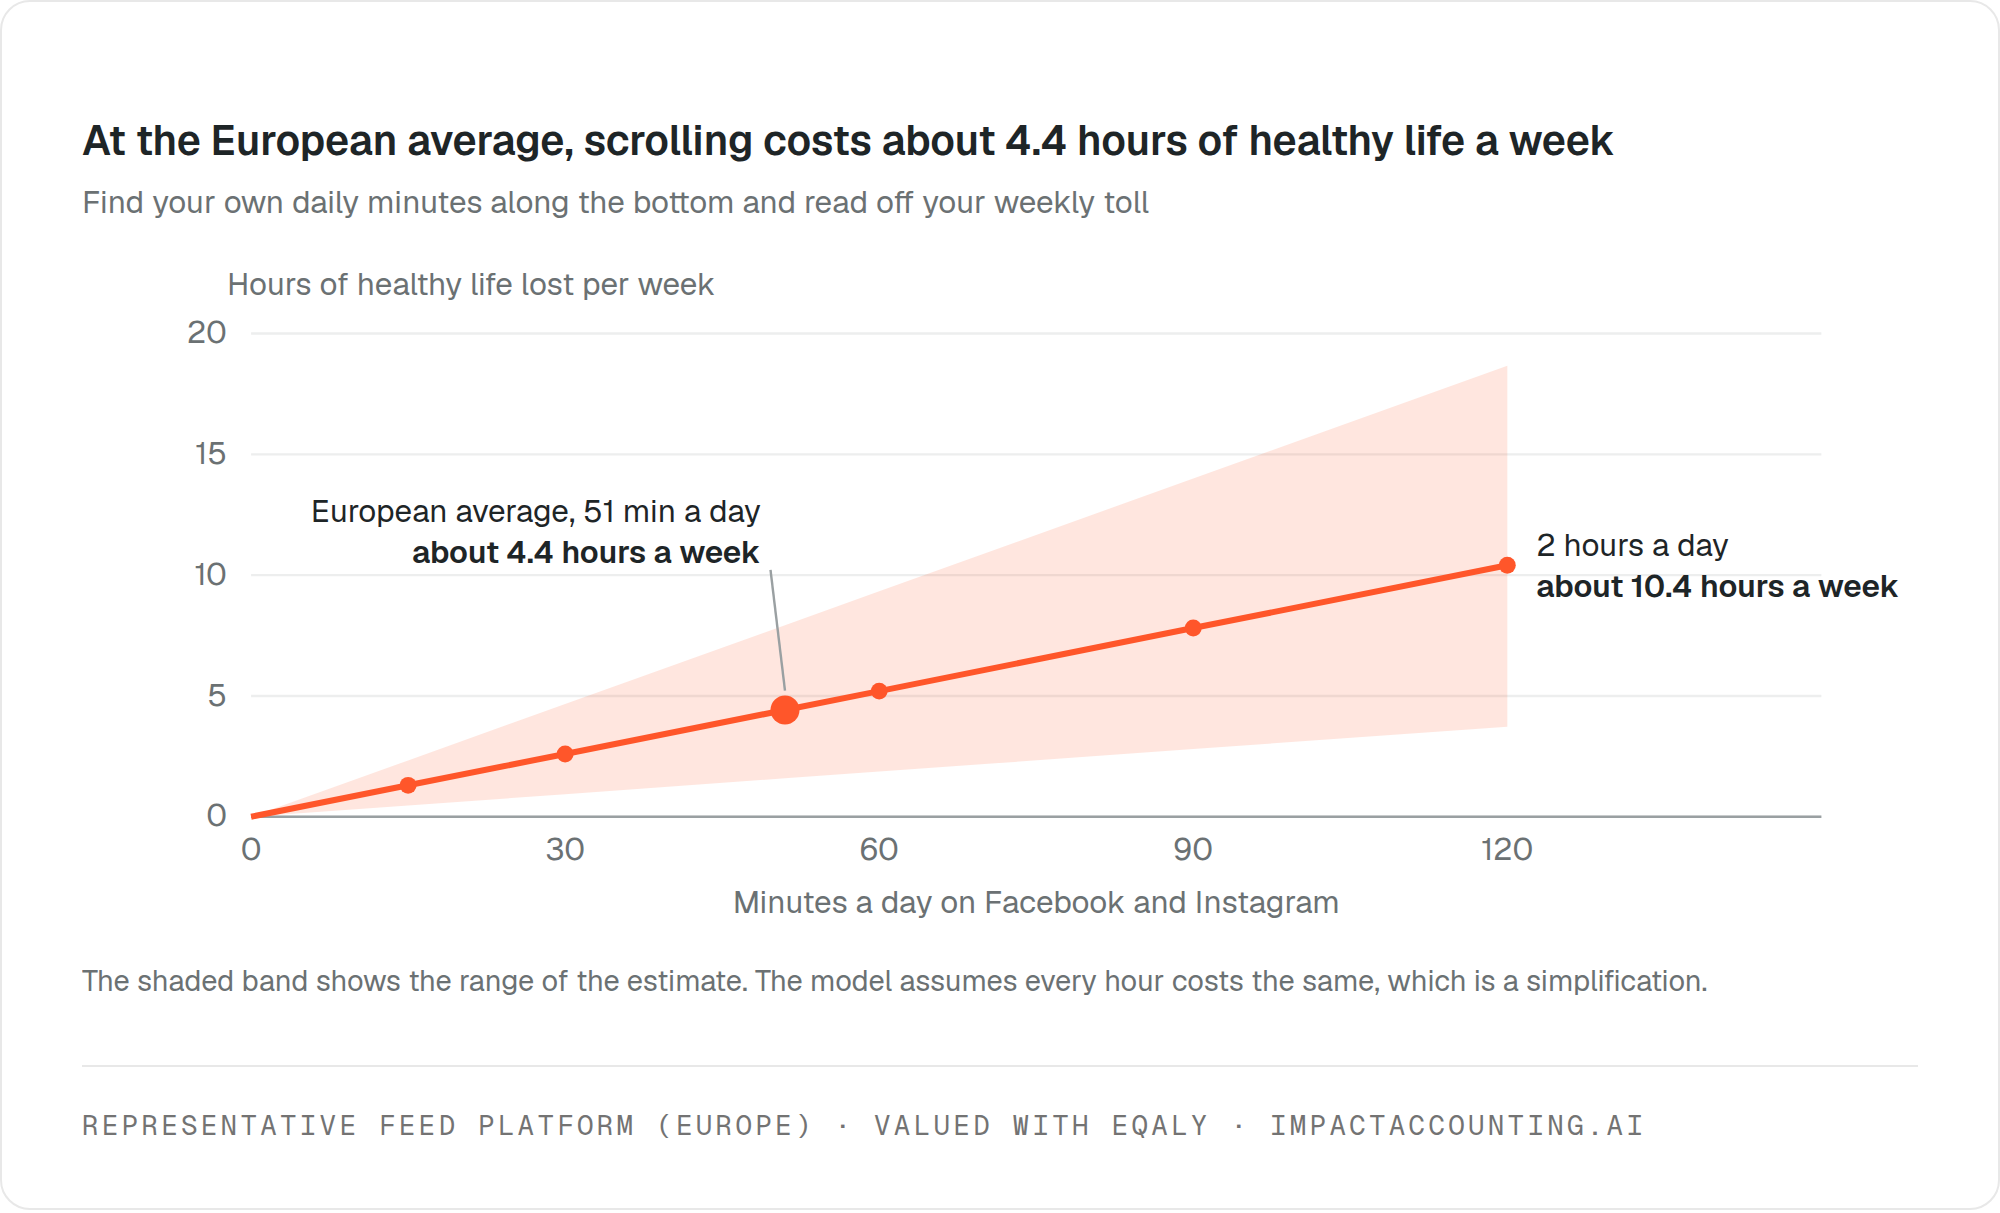
Source: impactaccounting.ai model R0, 44.6 minutes of healthy life per hour (range 16 - 80) [17]; European average from UK tracking data [1, 2]
Now, if you are wondering what “healthy life” means here, it is simply our quality of life, not how long we live. Nobody dies 45 minutes earlier for each hour scrolled (at least, until proven otherwise). What the number says is that the drop in how we feel is worth as much as 45 minutes lived in full health.
If you want to dig deeper, the eQALY method behind the software is explained on the Valuing Impact website [18]. In short, a year lived in full health counts as one. Every effect, whether on mood, health, income or the environment, is translated into healthy years gained or lost, and only then monetised as societal value [18]. It is the same approach we use with organisations to understand what their products, projects or supply chains do to people’s lives. Social media just happens to be the one product almost all of us use every day.
How this was built in impactaccounting.ai
The assessment models one pathway. Feed use changes how satisfied users are with their lives. That change is converted into eQALYs and then monetised at USD 62,082 (about €54,900) per eQALY. A second line shows the operating profit the platform makes on the same hours.
The data come from four kinds of source. Public data, such as Eurostat statistics on social media use and life satisfaction, Ofcom usage tracking and Meta’s financial reports. Scientific evidence, mainly the randomised quitting trials. The software’s own databases, for the value of an eQALY. And explicit estimates where no data exist, such as feed time across Europe, how long the effect lasts and the transfer from US trials to European users, each with a low, central and high value.
You can explore the method and run your own assessments at impactaccounting.ai.
Same hour, same toll
Now look at the same hour of scrolling from three angles. Each tells a very different story about the user. None of them changes the platform’s operating profit.
| One hour of scrolling, measured by | What it means for you | The platform’s operating profit |
|---|---|---|
| What you say it is worth, meaning how much you would want to be paid to give it up [6] | You feel you gain €2.60 - 4.60 | €0.16 |
| How it actually makes you feel, from the quitting experiments [6, 7] | You lose about €4.70 | €0.16 |
| What if everyone quit together? [11, 12] | You lose about €0.22, as you would pay a little to see the app gone for everyone | €0.16 |
Read the table from top to bottom. If you only ask people, scrolling looks like a good deal. Measure how it affects their wellbeing, and it turns into a loss of about €4.70 an hour. Ask what would happen if everyone logged off at once, and users would actually pay a little to see the app gone. Through all of this, the platform’s 16 cents of operating profit on the hour stay the same.
Why does that matter? Because the platform’s income does not depend on whether we end up better or worse off, and that is exactly the point. In a normal market, a product that makes its customers worse off eventually loses them. Here, advertisers pay for the hour, so the platform earns the same whether that hour did us good or harm. In the central case users lose about 30 times the platform’s operating profit, and for the two to break even, an hour of scrolling would have to cost us less than 1.5 minutes of healthy life.
There is also the question of where part of that profit comes from. If about 31% of our scrolling is time we would rather not spend, as a US study estimates [10], and the same holds in Europe, then about €4.1 billion a year of the platform’s European operating profit (€2.7 - 5.9 billion) is earned on exactly those hours. In other words, part of the business model depends on us doing what we ourselves would prefer not to do.
What the number leaves out
My estimate covers adults only, simply because the experiments stop at 18. The evidence on teenagers, however, is hard to ignore. In a World Health Organization (WHO) survey across Europe, Central Asia and Canada, problematic social media use among 11 to 15-year-olds rose from 7% in 2018 to 11% in 2022, with girls hit harder than boys [19].
The popular fixes come with risks of their own, and bans are hard to enforce. Three months into Australia’s ban for under-16s, 81.5% of them were still using social media, down from 85.9%, even though the share with an account of their own fell from 52% to 42% [20]. Age checks also bring a different kind of problem. To settle a case brought by nearly every US state, Meta agreed to work out the age of every user there, adults included, from ID documents, selfies or their activity [21]. That means handing even more personal data to the same company.
Privacy, polarisation and the effects on public debate are also outside the number. Some of them may never be easy to value, which is one more reason to read €4.70 as a partial figure.
Where I could be wrong
There are four good reasons to take my 45 minutes with a pinch of salt.
- The trials are American, short and close to elections. Both experiments behind my estimate were run in the US by Allcott, Gentzkow and colleagues, measured a few weeks away from the apps rather than a full year, and took place just before US elections, when feeds are full of politics [6, 7]. If the effect in an ordinary year were half as large, the cost would be about €2.30 an hour rather than €4.70. The harm also probably sits in compulsive hours more than in a quick check on a friend.
- Not all studies agree. A 2025 review in Scientific Reports by Lemahieu and colleagues pooled ten studies in which adults quit social media completely, and found no significant change in mood or life satisfaction [22]. Life satisfaction is exactly the measure my estimate relies on. Two broader reviews point the other way. Liu and colleagues, pooling 20 randomised trials in Behavioral Sciences, and Lopes and colleagues, pooling 35 experiments in a preprint co-authored by the social psychologist Jonathan Haidt and not yet peer reviewed, both find that cutting back improves wellbeing [23, 24].
- The polarisation charge might be weaker than it sounds. In the US 2020 Facebook and Instagram Election Study, independent academics working with Meta changed the feeds of tens of thousands of users during the campaign, and attitudes did not measurably shift within three months [25].
- People say they value it, and advertisers gain too. Taken at their word, users come out of each hour well ahead of the platform’s operating profit. A 13-country survey led by Stanford’s Erik Brynjolfsson, with co-authors who work or worked at Meta, found however that Europeans value Facebook less than Americans do. The median user in Europe would give it up for about USD 32 - 33 a month, against about USD 49 - 53 in the US [26]. Meta’s own study links its personalised ads to €213 billion of EU economic activity [27], though that is a gross figure that ignores where else the money would go.
What this means for decision makers
The same hour shows up on both sides of double materiality. On the impact side, it is a cost carried by users. On the financial side, it is a risk for the business that earns from it, and for those who invest in it or buy its audience.
| Materiality | What the numbers show | Sources |
|---|---|---|
| Impact: users’ wellbeing | About 7 million healthy life years lost each year by 269 million adult users in Europe, a societal value of roughly €388 billion, from one pathway only | [17] |
| Financial: profit exposed to design rules | About €4.1 billion a year of European operating profit (€2.7 - 5.9 billion) earned on hours people would rather not spend | [10, 17] |
| Financial: regulatory risk | In July 2026 the European Commission preliminarily found that the design of Instagram and Facebook breaches the Digital Services Act, naming infinite scroll, autoplay, push notifications and personalised recommendations. A confirmed breach could cost up to 6% of global turnover | [28, 29] |
| Financial: legal risk | In March 2026 a California jury found Meta and YouTube negligent in how they designed their platforms, with infinite scroll, autoplay and algorithmic recommendations among the features at issue | [30] |
| Financial: public pressure for rules | 63% of EU citizens want age rules for children’s social media, and 60% see children’s exposure to addictive design as a significant risk | [31] |
- Investors can use a figure like this in due diligence and engagement. The useful question is how much revenue depends on hours users would rather not spend, and what happens to it if autoplay and infinite scroll are switched off by default, as the Commission wants [29].
- Advertisers buy those hours. They can ask platforms how much of their reach comes from compulsive use, and look at the wellbeing cost of their media spend the same way they already look at emissions in their supply chain.
- Regulators get a common unit to compare options. Design rules have good evidence behind them. When US users were offered a simple tool to cap their daily use, 89% took it up, their use fell and stayed down, and they were even willing to pay to keep it [32]. Default limits like this would reduce the profit earned on unwanted hours, which is where the cost sits.
The open questions in the end are political, and a valuation cannot settle them. Is 30 cents a fair price for an hour that costs the person spending it far more? Who should carry that cost, through design rules, liability or something else? And how much personal data are we willing to hand over to protect children online? In the meantime, have another look at your weekly hours, and ask yourself how many of them you actually chose.
Method in brief
My model covers one year (2025) of a representative ad-funded feed platform in the EU, UK, Norway, Iceland and Switzerland, calibrated on Facebook and Instagram feeds, with 269 million adult users spending 51 minutes a day in the feeds, Messenger excluded (309 hours a year), from UK passive-tracking data [1, 2]. Revenue per user is €77 - 104 (Meta’s Europe revenue divided by an estimated 408 - 550 million users in the region), with the 51.6% operating margin of Meta’s Family of Apps business [3, 4]. The software run used an earlier revenue figure, which changes the shareholder line only. The wellbeing effect, 0.077 standard deviations of the 2018 trial’s wellbeing index (0.04 - 0.12), is scaled from that trial, consistent per minute with the 2020 trial, and assumed to last the whole year, although the trials ran for weeks [6, 7]. One life-satisfaction point for a year equals 0.183 eQALYs (0.136 - 0.196) [13-16], monetised at USD 62,082 (about €54,900) each in impactaccounting.ai and reproduced in a separate workbook [17, 33]. Teenagers, polarisation, privacy, advertisers’ gains and other platforms are not counted. The ranges combine the low and high ends of the main inputs, so they are not statistical confidence intervals. Amounts are converted from US dollars at the 2025 average rate of 1.13 dollars per euro [34]. Figures reported by US studies and courts stay in dollars.
References
- Ofcom (2025). Online Nation 2025.
- Eurostat (2025). Individuals using the internet for social networks, isoc_ci_ac_i.
- Meta (2026). Q1 2026 earnings presentation (revenue by user geography).
- Meta (2026). Fourth quarter and full year 2025 results.
- Varoufakis, Y. (2023). Technofeudalism: What Killed Capitalism. Bodley Head.
- Allcott, Braghieri, Eichmeyer and Gentzkow (2020). The Welfare Effects of Social Media. American Economic Review 110(3).
- Allcott et al. (2026). The Effect of Deactivating Facebook and Instagram on Users’ Emotional State. American Economic Journal: Economic Policy, forthcoming.
- Meta (2023). Digital Services Act report on average monthly active recipients in the EU, February 2023.
- Relevant Audience (2026). Meta’s EU filing puts Instagram at 297 million users and Facebook at 264 million.
- Allcott, Gentzkow and Song (2022). Digital Addiction. American Economic Review 112(7).
- Bursztyn, Handel, Jimenez-Duran and Roth (2025). When Product Markets Become Collective Traps: The Case of Social Media. American Economic Review 115(12).
- Bursztyn, Handel, Jimenez-Duran and Roth (2026). Product market traps in social media. The Hamilton Project, Brookings.
- Happier Lives Institute (2026). Current estimates of the neutral point.
- Eurostat (2025). Overall life satisfaction, ilc_pw01 and ilc_pw05.
- Grochtdreis et al. (2019). EQ-5D-5L normative values for Germany. European Journal of Health Economics 20(6).
- HM Treasury (2021). Wellbeing guidance for appraisal: background paper.
- impactaccounting.ai, Representative feed platform (Europe), model R0, published 17 November 2026 (available on request).
- Vionnet, Souza, Pacharotti, Tagliari and Sacayon (2024). The eQALY Impact Valuation Method. Valuing Impact.
- WHO Europe / HBSC (2024). Report on adolescent social media use in Europe, Central Asia and Canada.
- eSafety Commissioner (2026). Early insights from eSafety’s evaluation of the social media minimum age.
- Gulf News (2026). Meta’s US teen settlement faces age verification and privacy challenges.
- Lemahieu et al. (2025). The effects of social media abstinence on affective well-being and life satisfaction. Scientific Reports.
- Liu, Mohamad, Azlan and Tan (2025). Social Media Detox and Well-Being: A Meta-Analysis of Randomized Controlled Trials. Behavioral Sciences 15(3).
- Lopes et al. (2026). Effect of Social Media Constraints on Mental Health. medRxiv preprint.
- CSMaP (2023). First four papers from the US 2020 Facebook and Instagram Election Study.
- Brynjolfsson, Collis, Liaqat et al. (2024). The Consumer Welfare Effects of Online Ads. NBER Working Paper 32846 (several co-authors work or worked at Meta).
- Meta (2025). Meta’s personalized ads boost Europe’s economy (company study).
- European Commission (2026). Commission preliminarily finds the addictive design of Instagram and Facebook in breach of the Digital Services Act, 10 July.
- Euronews (2026). Instagram and Facebook hook users with addictive design, Commission finds.
- Crowell (2026). Landmark verdicts against Meta and YouTube.
- Agensir (2026). Eurobarometer: Europeans call for stronger action on children’s online safety (survey for the European Commission, 19 - 24 June 2026, 25,904 respondents).
- Allcott, Gentzkow and Song (2026). Digital addiction: evidence and policy implications. The Hamilton Project, Brookings.
- Grilli, P. (2026). Attention economy study workbook v2 (available on request).
- Eurostat (2026). Euro exchange rates, annual data (ert_bil_eur_a), based on the European Central Bank’s reference rates.