

Explanation
Financial value, or what your impact is worth to the company
Whatever the harm to people and nature, does any of it actually reach the P&L? How to read the Financial Value screen — the lever lines, the evidence labels, and the checks worth running before the result meets a CFO.
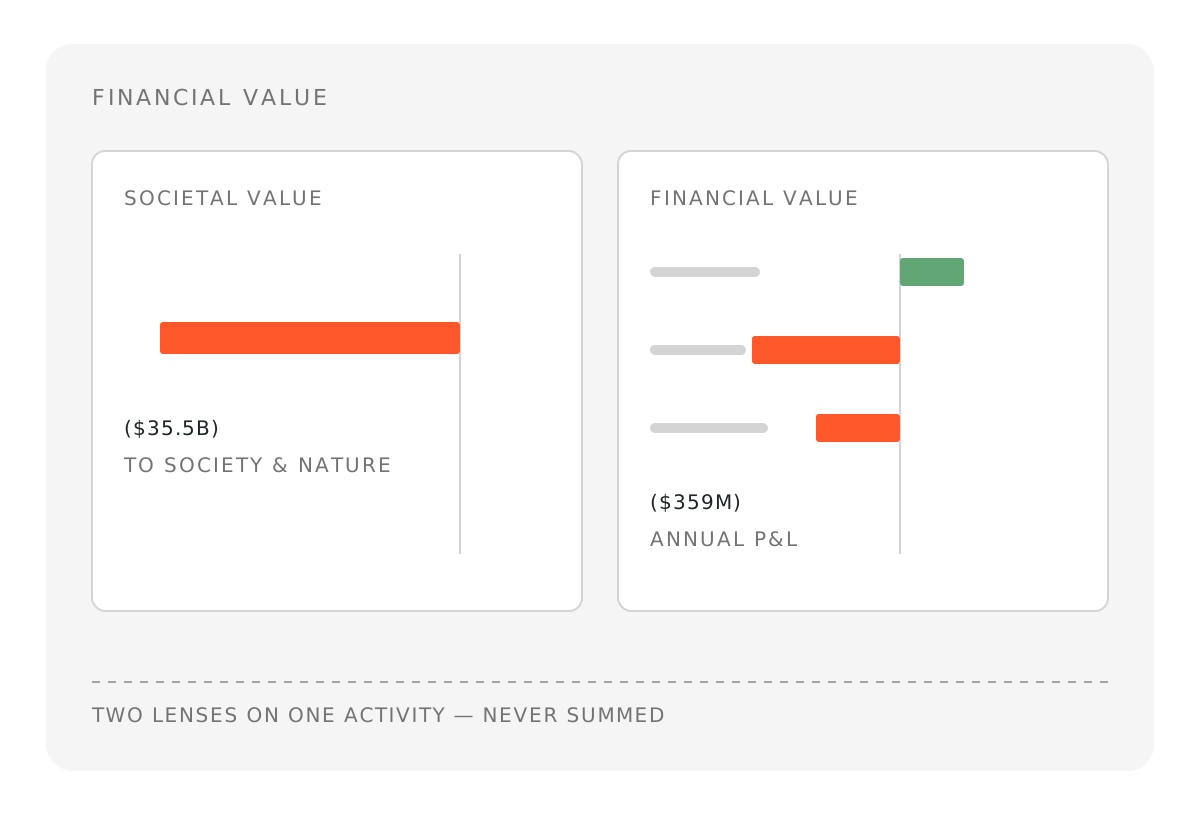
Nestlé's societal value for 2025 models at roughly minus 35.5 billion dollars. That is a defensible number and a hard one to take into a room where the next question is about the accounts. Whatever the harm to people and nature, does any of it actually reach the P&L?
That question has an answer, though not the one people expect. Societal value and financial value are two lenses on the same set of activities, and they are never summed. The Financial Value screen takes the pathways already modelled in the assessment and asks a different question of each one, namely whether it plausibly touches revenue, costs or risk, and by how much.
What the screen gives you
Open the assessment, go to Model and select Financial Value. The agents work through the modelled pathways and return a set of lever lines, each tied to a business mechanism rather than a societal outcome. Regenerate re-runs the screen after the underlying societal valuation changes, or use the chat to request specific adjustments in the financial value model.
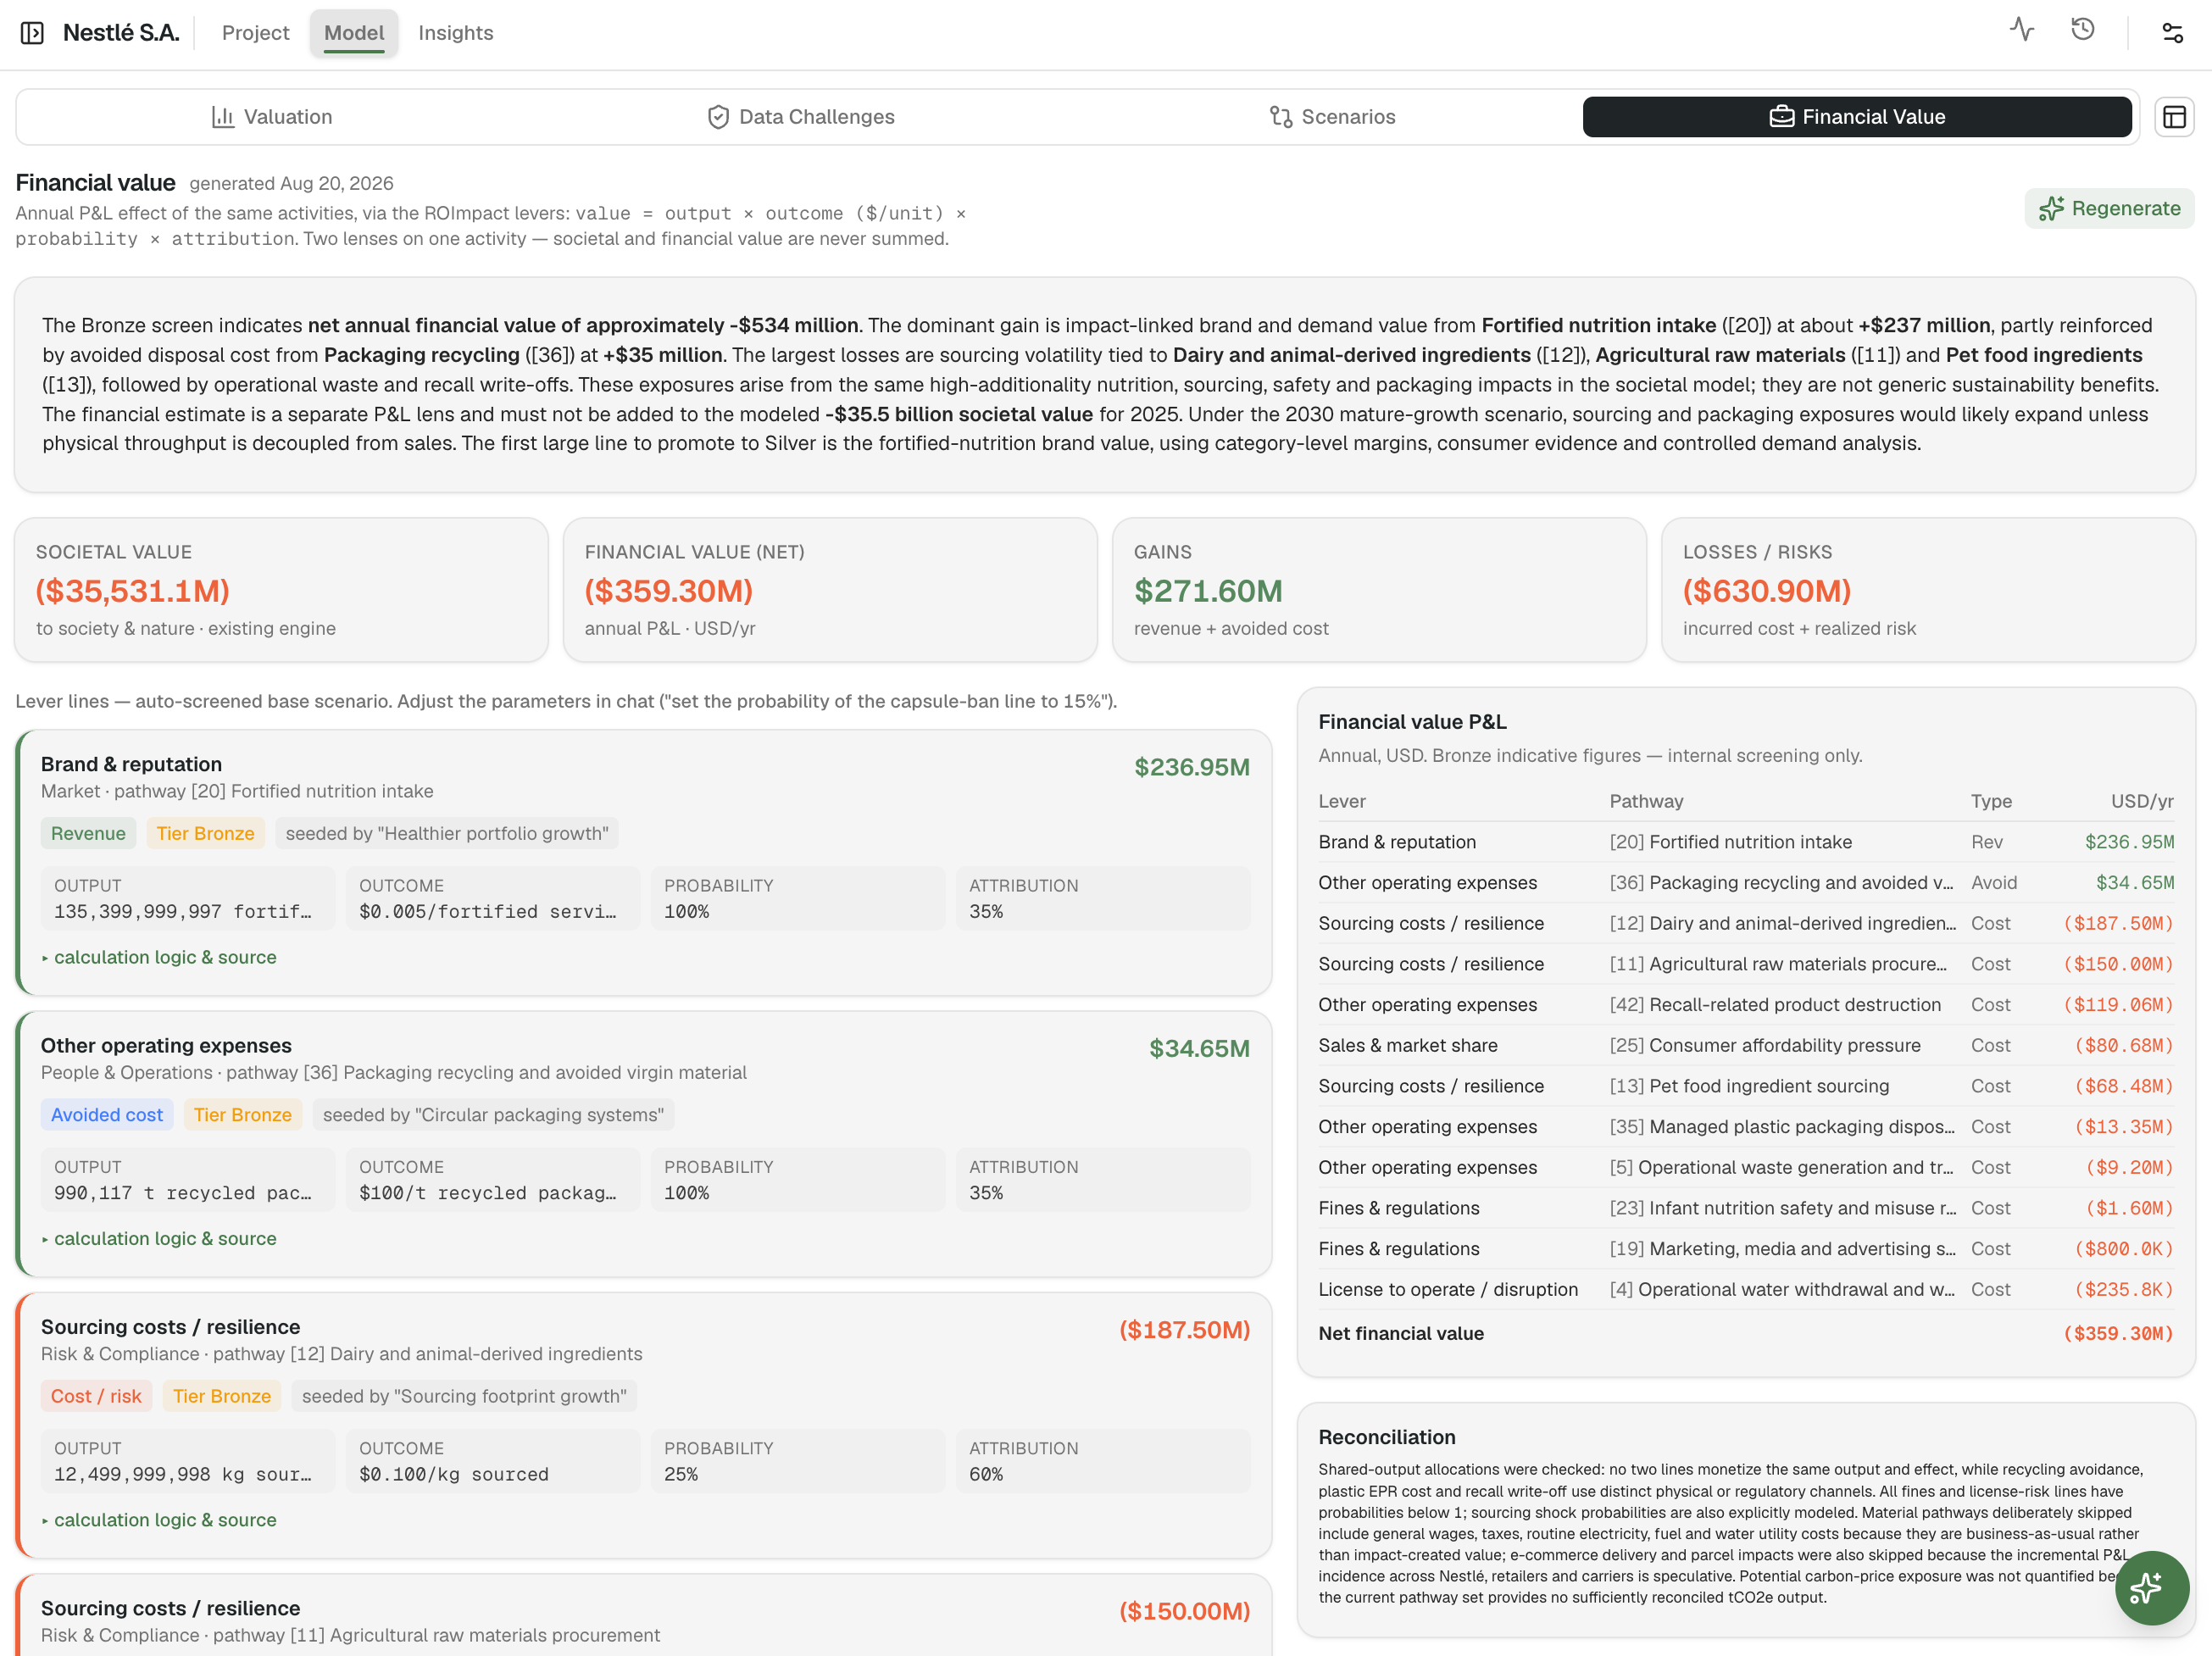
For Nestlé the screen returns gains of 272 million dollars against losses and risks of 631 million, leaving a net annual financial value of minus 359 million. The societal figure of minus 35.5 billion sits beside it, unchanged and uncombined.
Two numbers, two mechanisms, no arithmetic between them. Societal value prices well-being and welfare. Financial value prices margins, avoided costs and probability-weighted risk. The gap between 35.5 billion and 359 million is not an error, it is the point. Most of what Nestlé costs society never reaches Nestlé.
Reading the result
The net figure is the least interesting number on the page. What matters is which lines produce it and how much weight each one can carry.
Start with the line that decides the answer
Twelve lines make up the Nestlé screen, and one of them carries almost the entire positive side. Brand and reputation on pathway [20], fortified nutrition intake, comes in at roughly 237 million dollars, which is 87 per cent of all gains. The only other gain on the page, the packaging recycling line, is worth about 35 million.
Expanding calculation logic & source on that line shows what it rests on.
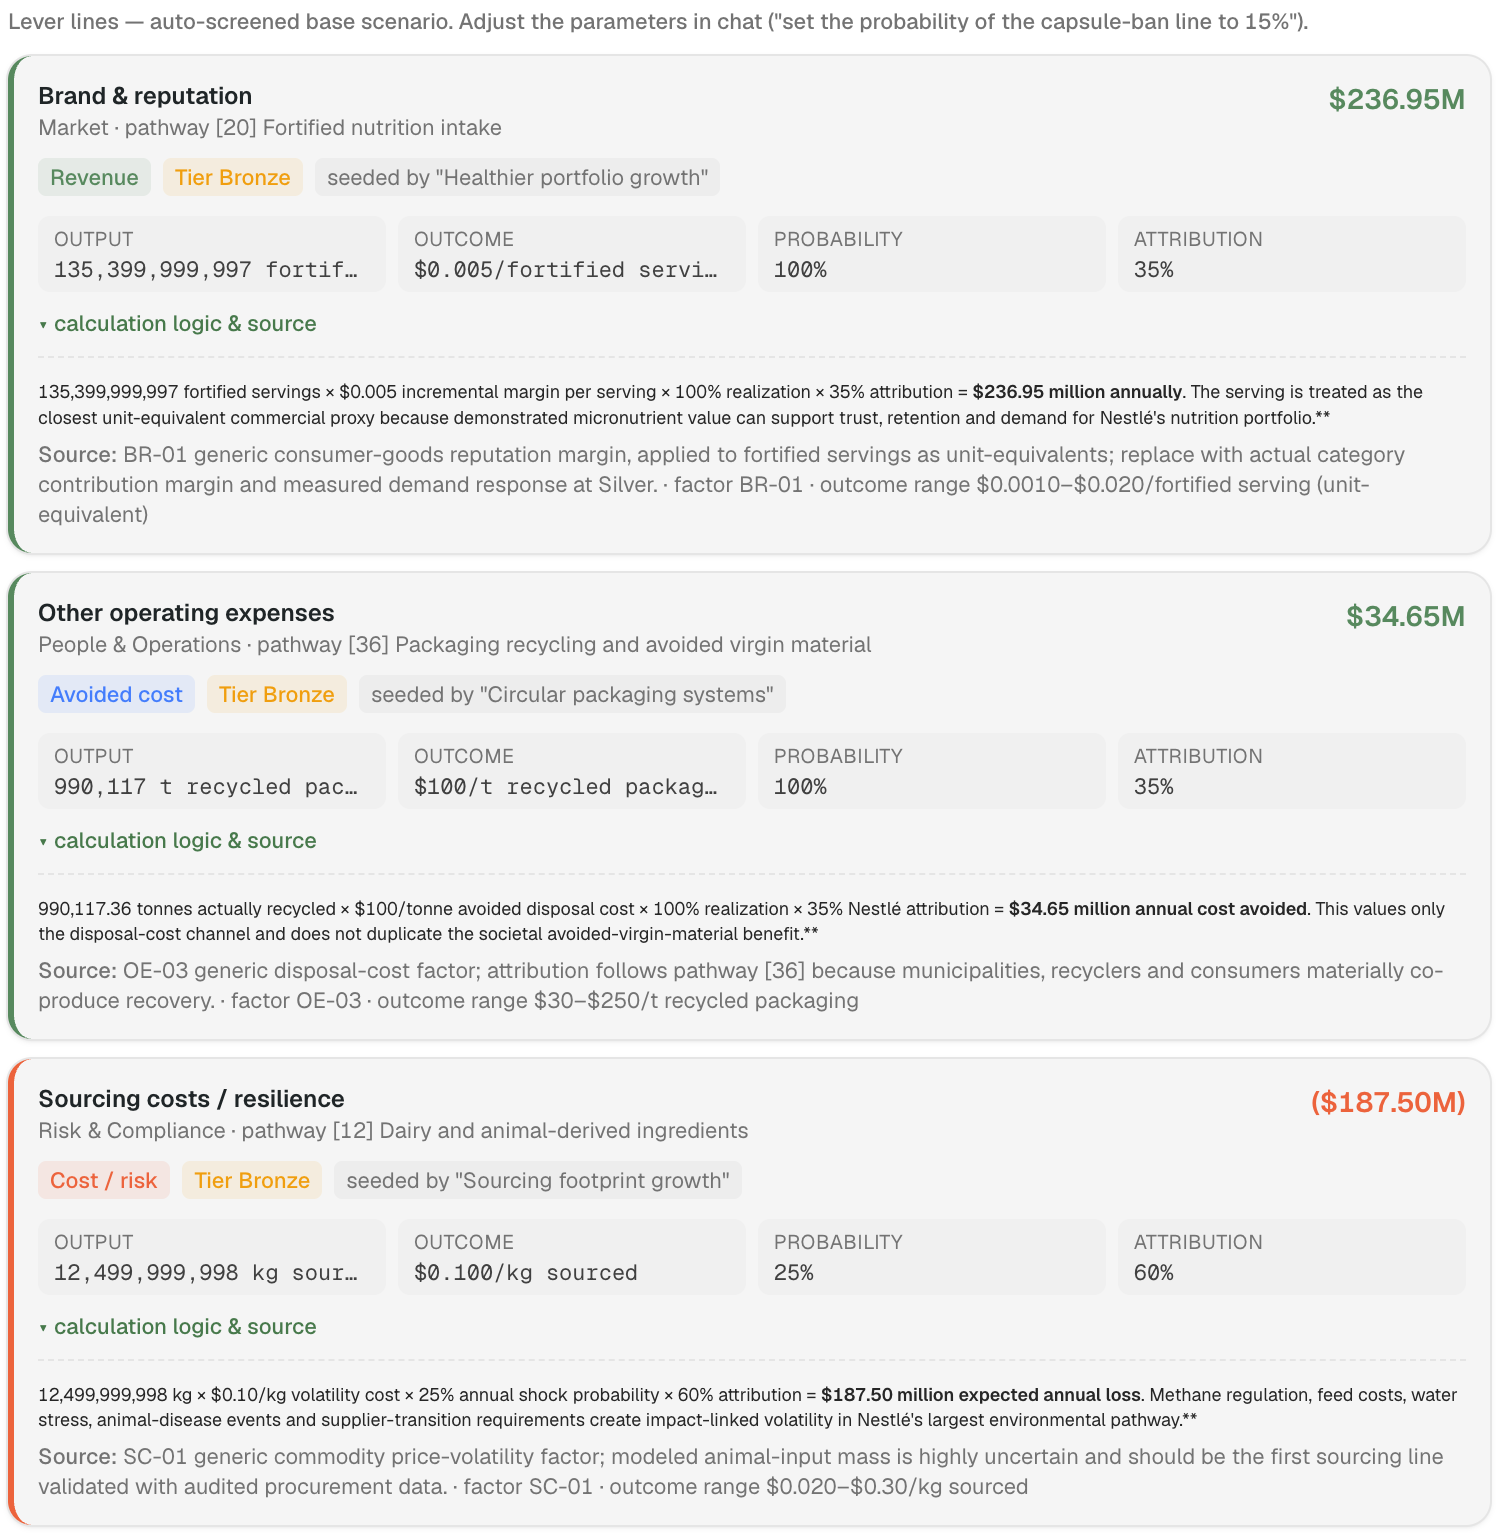
The calculation is 135 billion fortified servings at half a cent of incremental margin per serving, realised in full, with 35 per cent attributed to Nestlé. Every line also carries an evidence label, and this one sits at the weakest of the three levels, meaning it rests on a generic consumer-goods reputation margin applied to servings as unit-equivalents rather than on anything measured at Nestlé.
The source publishes the range that generic factor spans, from a tenth of a cent to two cents per serving. Run the line at each end and the whole result moves.
| Margin per serving | Brand line | Net financial value |
|---|---|---|
| $0.001 (low) | 47M | (549M) |
| $0.005 (base) | 237M | (359M) |
| $0.020 (high) | 948M | +352M |
One factor, moved within the range its own source declares, takes the company from destroying roughly 549 million dollars of business value a year to creating 352 million. The sign flips without anyone having done anything wrong.
That is the first check worth running on any Financial Value result. Find the line carrying the most weight, open its source, and see what the stated range does to the conclusion. The source note on this one says as much itself, asking for an actual category contribution margin and a measured demand response in place of the generic figure.
A risk and a cost are not the same number
Not every number in the cost column means the same thing.
Dairy and animal-derived ingredient sourcing on pathway [12] is the largest cost on the screen. It is 12.5 billion kilograms sourced at ten cents of volatility cost per kilogram, carrying a 25 per cent annual shock probability and 60 per cent attribution. The 188 million dollars shown is an expected annual loss rather than an annual bill. If the shock lands it is nearer 750 million, and in three years out of four there is none at all.
Two rows below it the screen puts a very different kind of number.
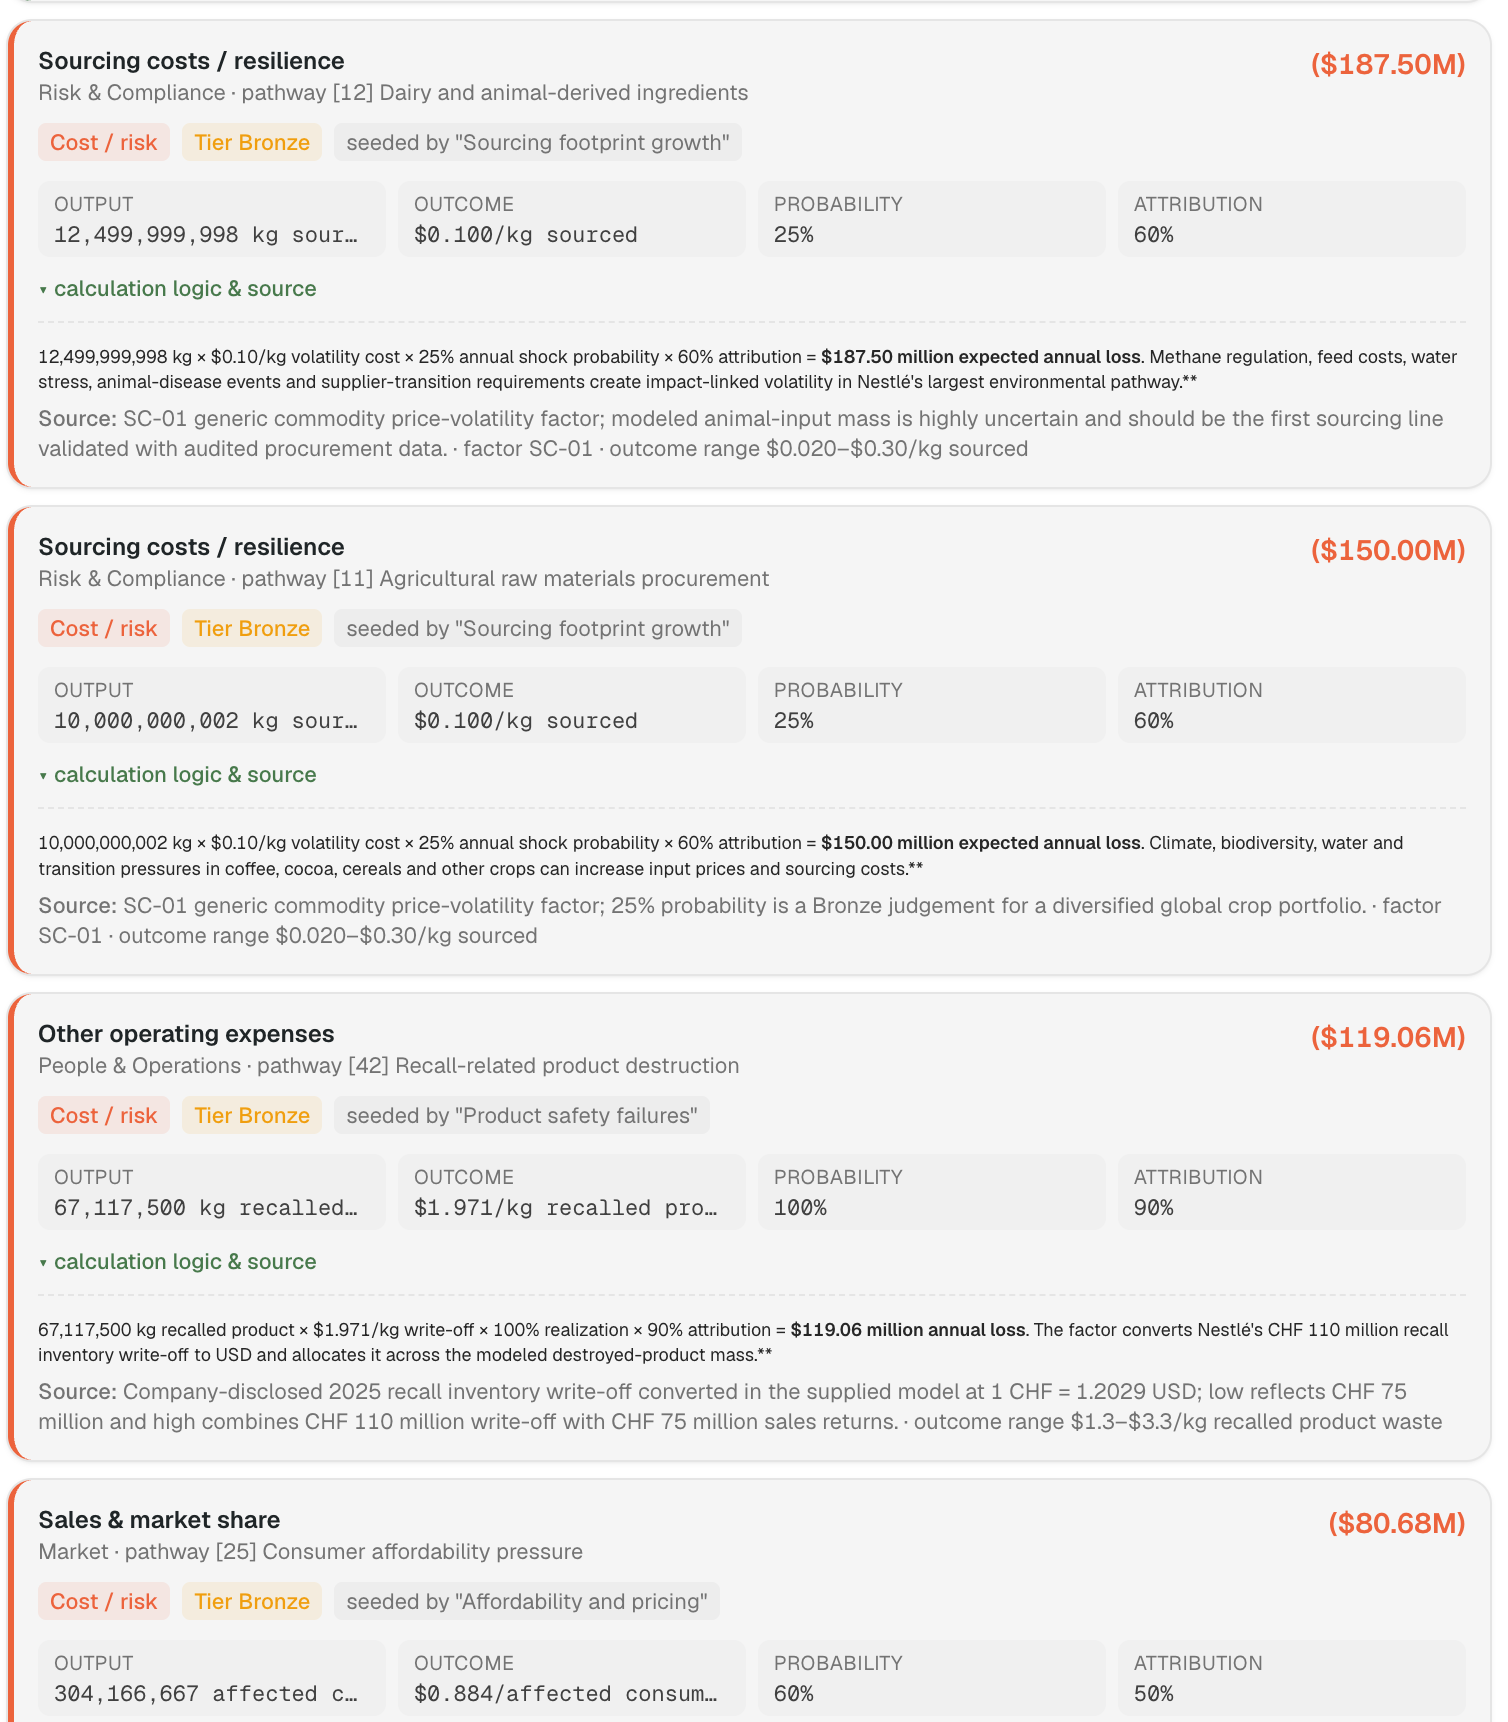
Recall-related product destruction on pathway [42] is 67 million kilograms of destroyed product at 1.97 dollars a kilogram, realised in full and attributed at 90 per cent, for 119 million dollars. It is also the best-evidenced line on the page, because that unit rate is not a generic factor at all but Nestlé's own disclosed 2025 recall inventory write-off of 110 million Swiss francs, converted into dollars and spread across the destroyed mass.
Worth noting what the 90 per cent is doing there. The unit rate is back-derived from a figure the company reported as its own write-off, so output times outcome already equals the disclosed cost. The attribution then trims a known number down by a tenth, on the basis that not every recall traces to the pathway being priced. That is defensible, and it is also the one place on this screen where the best evidence produces a figure lower than the company's own accounts. Worth knowing before a finance director asks.
Two rows apart in one table, then, and two entirely different kinds of number. One is a probability-weighted estimate resting on a generic factor. The other is money that has already left the business, evidenced by the company's own accounts. A finance director who reads them the same way will either over-provision against the first or stop trusting the screen.
Read the reconciliation box
The reconciliation box has one job, which is to tell you what the screen did not do. For Nestlé it confirms that recycling avoidance, plastic packaging cost and recall write-off run through separate physical or regulatory channels rather than monetising one quantity three times. It then lists what was left out on purpose, including general wages, taxes and routine utility costs, on the grounds that these are business as usual rather than impact-created value.
The omissions matter more than the confirmations. Carbon-price exposure is absent from the Nestlé result because the current pathway set produces no tonnage reconciled well enough to price, and a reader who never opens the box will not know that.
When the answer comes out positive
Nestlé is a large company with a long value chain and most of its financial exposure on the cost side. A smaller, single-product business produces a different shape.
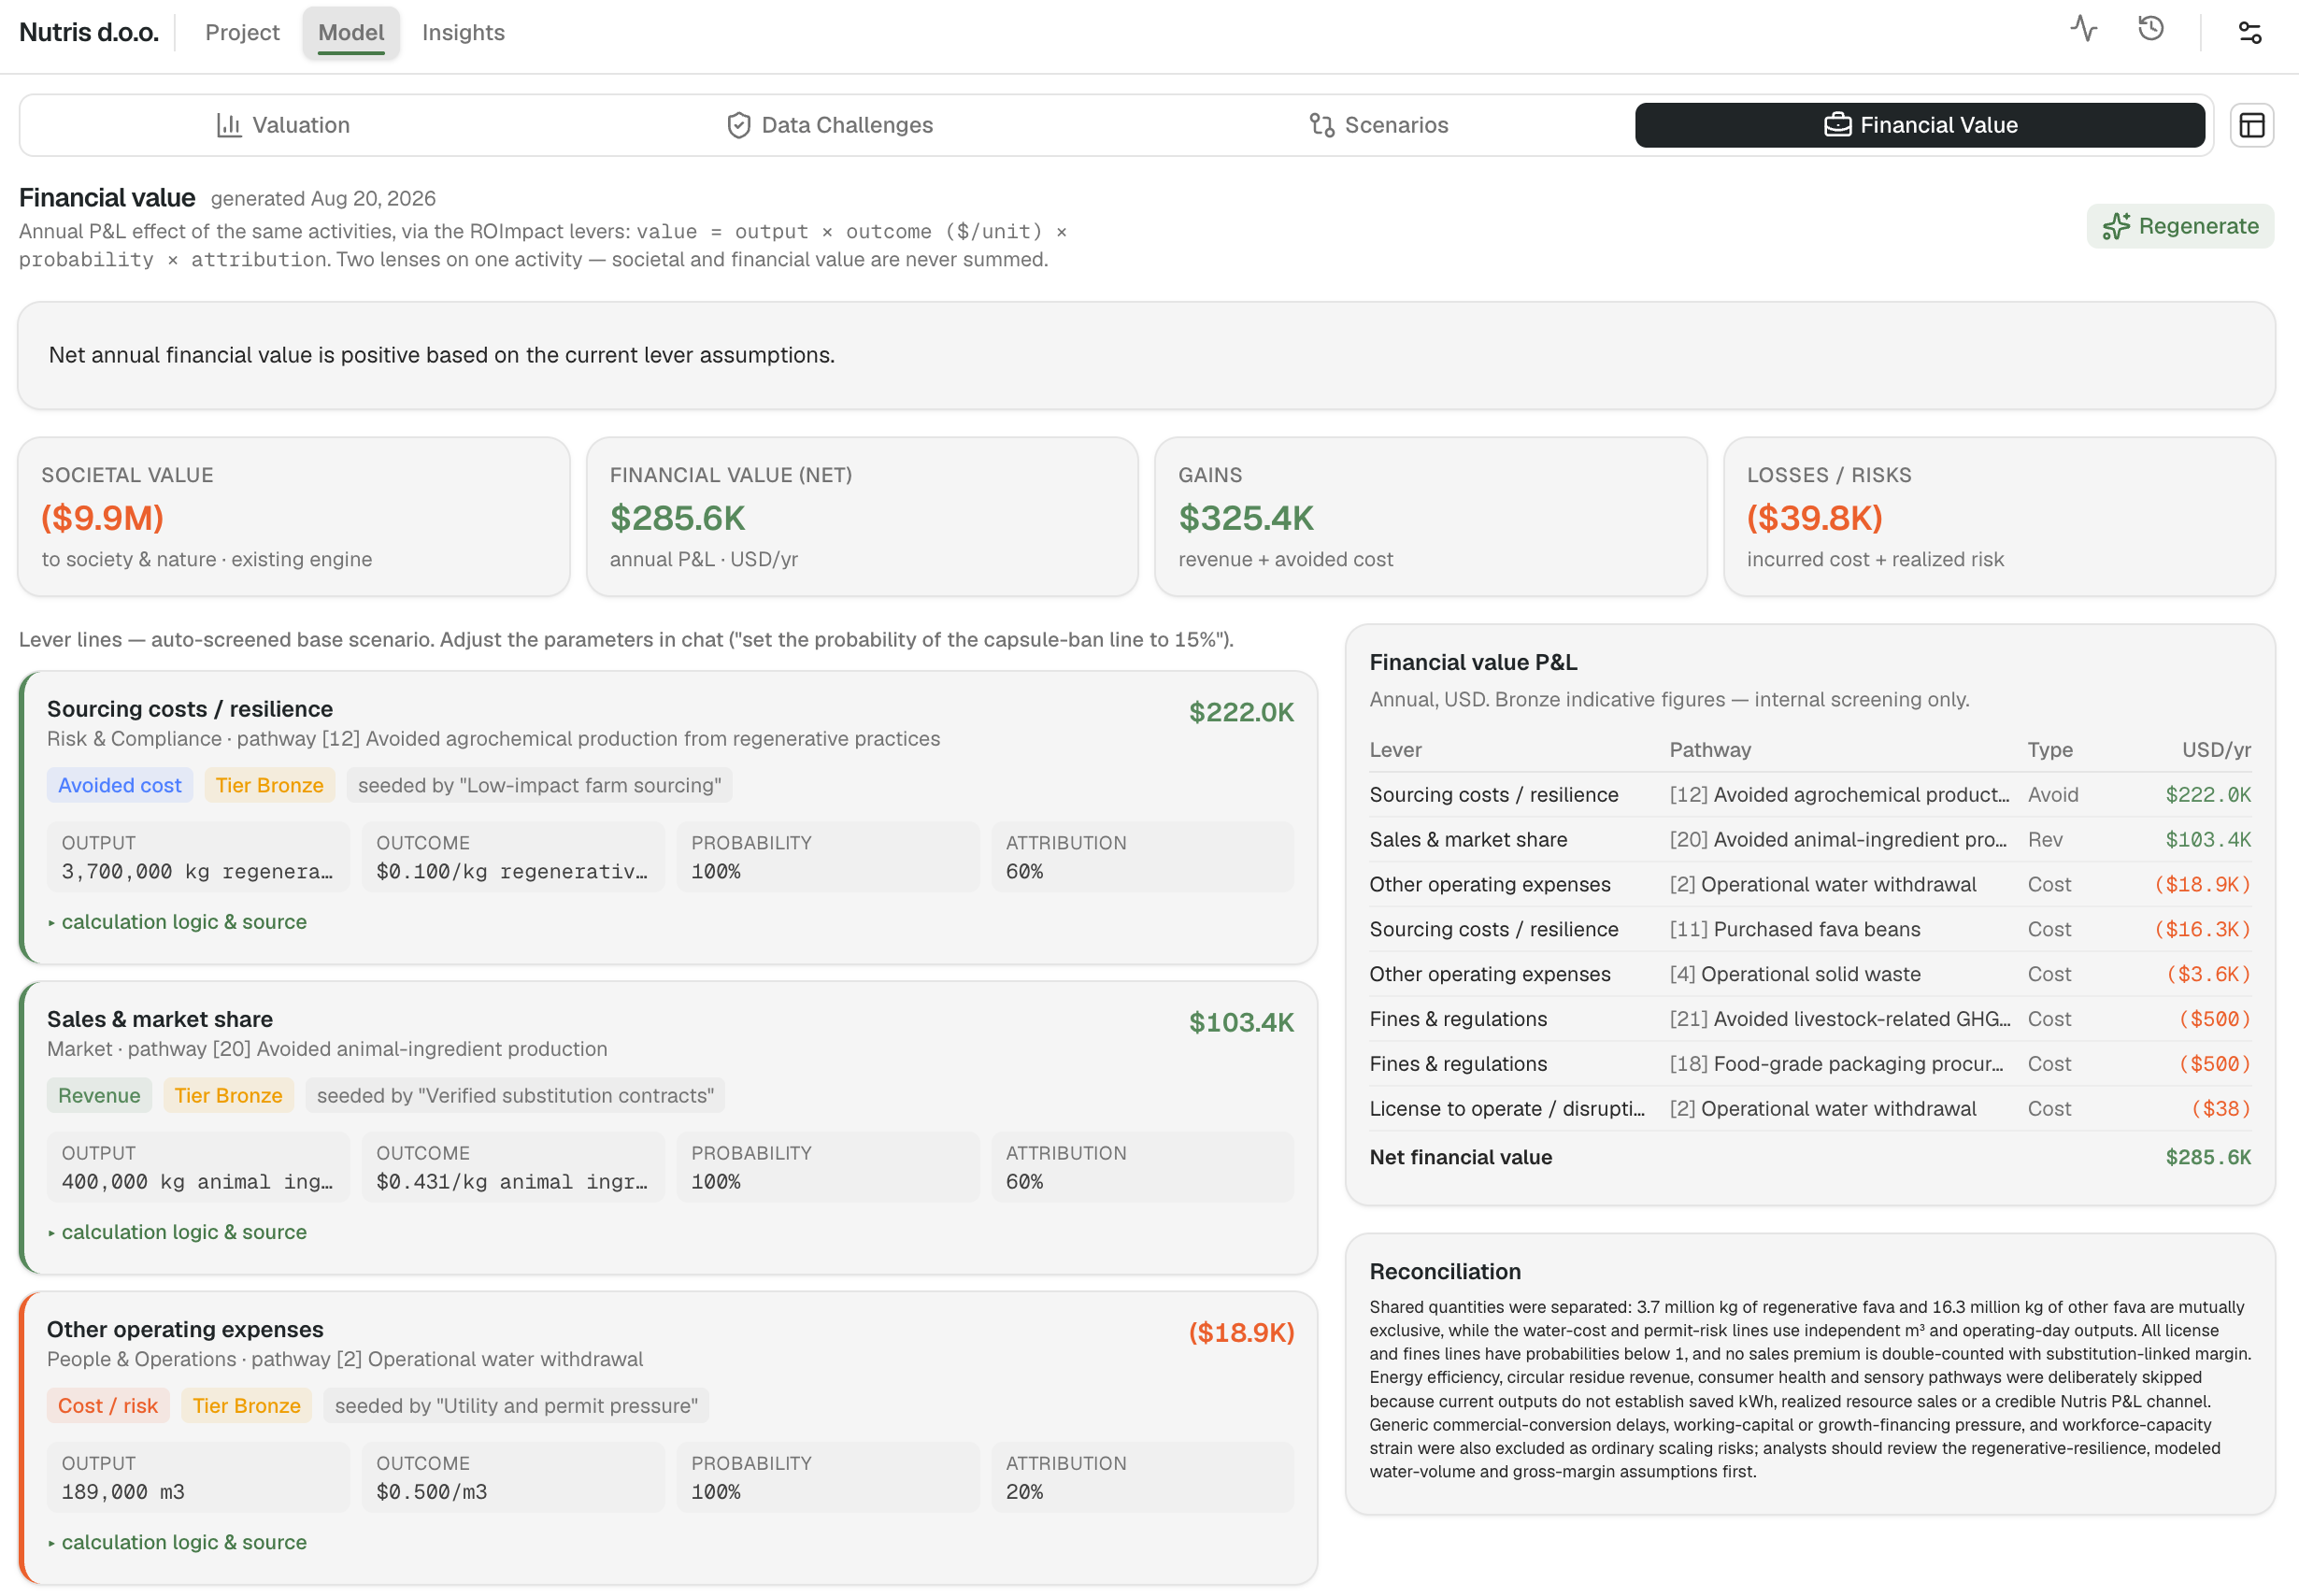
Nutris, a fava-bean protein producer, returns eight lines rather than twelve, and the two gains outweigh the six costs. Avoided agrochemical production from regenerative practices contributes 222,000 dollars of avoided cost, and avoided animal-ingredient production contributes 103,000 dollars of revenue, against costs and risks totalling 40,000 dollars. Net financial value is positive at 286,000 dollars, while societal value is still negative at 9.9 million.
Two things are worth noticing beyond the sign. The gains sit in avoided cost and substitution revenue rather than in a reputation proxy, which is a sturdier place for them. And the reconciliation shows the double-counting control doing real work, holding the regenerative fava volume apart from the conventionally sourced volume so that the regenerative benefit and the sourcing cost cannot both claim the same beans.
Working with the result
The screen is not a report that arrives finished. Three things are worth doing before anyone else sees it.
1. Ask the chat to explain a line before changing it. Any figure can be interrogated in plain language, and asking why the brand line uses half a cent per serving returns the reasoning and the source faster than inferring it from the fields. This is the right first move on any number that looks wrong, because a surprising number is often correct and badly labelled.
2. Ask it to adjust what you know is wrong. Parameters are set through the chat directly, in the form of instructions like setting the probability of a particular line to 15 per cent. Where a real figure exists, give it and let the line be revised. Actual category margins, audited procurement volumes, a measured demand response. Each replacement lifts a line off its generic factor onto company evidence, and doing that for the two or three lines that carry the conclusion is worth more than improving everything else combined. The Calibrate, don't re-run workflow covers this in full.
3. Regenerate when the underlying valuation changes. Financial lines read from the impact assessment but do not follow it automatically. Editing a societal pathway leaves the financial line attached to it untouched, and the reverse is also true.
Once the result holds up, it is ready for the committee conversation. Every line keeps its assumptions and its evidence label attached, so a reader can see what the headline rests on rather than discovering it in the meeting.
Where it stops
The Financial Value screen is a screening tool, and its own header says so, marking the figures as indicative and for internal use only.
It is not an audited figure, a cash-flow forecast, an accounting provision or an input to financial reporting. It should not be added to reported profit either, since the costs already sitting in the accounts were deliberately kept out of it. It does not prove that every financial consequence has been found, and it cannot confirm that its factors are accurate, only that they are visible and inspectable. A result still resting on generic factors is the start of a conversation with Finance rather than a conclusion to hand them.
What sits behind the numbers
Financial value follows the ROImpact Method, published by Valuing Impact as the business-value lens of its wider framework. Where the eQALY lens asks what an activity is worth to society, this one asks only what it is worth to the company, in revenues and costs. Assets and liabilities are left out deliberately, on the grounds that they are harder to act on in everyday management decisions. The method is symmetric, so a lever can destroy business value as easily as create it, and both sides are counted.
The equation
Every line resolves to the same calculation, shown at the top of the screen.
value = output × outcome ($/unit) × probability × attributionOutput is a countable result the business already tracks, such as tonnes of waste, kilograms sourced or days of disruption. Outcome is the money value of one unit of that output, taken from financial data rather than from societal value factors. Probability and attribution then adjust for how much of that value is really realised, combining the chance the effect occurs at all with the share of it that can credibly be linked to the company. The method paper groups the two as a single term, additivity. It is not the same construction as additionality in the eQALY method, which combines baseline, drop-off and attribution, and the two should not be read across.
The fourteen levers
Each line is assigned to exactly one lever, drawn from four groups. Market covers brand and reputation, IP and innovation, sales and market share, and price premium. Finance covers taxes and subsidies, capital expenditure, and debt and interest. Risk and compliance covers licence to operate and business disruption, fines and regulations, and sourcing costs and resilience. People and operations covers other operating expenses, payroll and employee costs, talent acquisition, and talent retention.
The one-effect-one-lever rule matters more than it sounds. A single activity often touches several levers at once, and counting the same saving under two of them inflates the total quietly rather than obviously. Nestlé's twelve lines use six levers between them, and the reconciliation box exists to show that no two of them monetise the same output and effect.
Probability is mandatory on three of the fourteen, namely licence to operate and business disruption, fines and regulations, and sourcing resilience, because each depends on an event that may not happen. Everywhere else it is applied only where the uncertainty is material enough to change a decision.
Where the numbers come from
Lines at the weakest evidence level start from generic factors, each carrying a code and a published range, so one is a consumer-goods reputation margin, another a disposal-cost factor, another a commodity price-volatility factor. Moving a line up a level means replacing that generic factor with company evidence, and the method expects that evidence to come from finance first. Contribution margins, payroll baselines and unit costs sit with finance or controlling teams, and using their figures is what lets a result survive contact with a CFO. Unit data comes from wherever it already lives, so operations and procurement for volumes and waste, HR for headcount and turnover, legal or compliance for fines and breaches.
Two habits carry most of the credibility. Measured results come before modelled ones, and every figure keeps a record of its source. That record is what turns a screening estimate into something repeatable.
The full method, including the lever playbook and a four-step protocol for estimating probabilities, is set out in From Impact to P&L, Meet the ROImpact Canvas. Field-level reference for each input on the screen is in the documentation.