

Case study
What one analysis is worth to society, and what it costs the climate
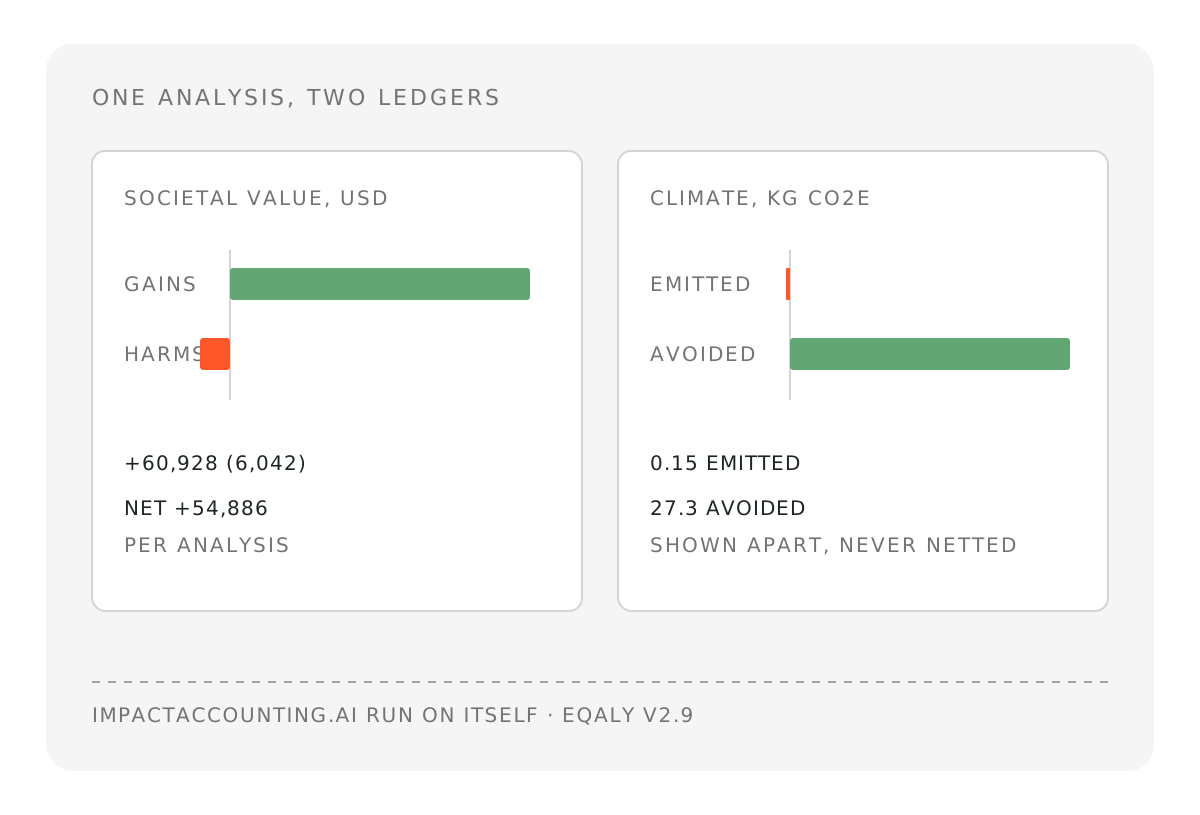
We ran impactaccounting.ai through its own method. One analysis creates about USD 55,000 of net societal value, 90% of it through the decision it informs, while the AI computing behind it emits about 0.15 kg CO2e.
Two questions come up often about impactaccounting.ai. Is the result worth the effort, and how much energy does all that AI use? The fairest way to answer both is to treat the software like any other organization and run it through the same method it applies to everyone else. This piece does that for one analysis on impactaccounting.ai, followed from the confirmed brief to the published Deck, and reports the impact statement the software produced about itself.
One analysis creates a modeled net societal value of about USD 55,000, made of USD 60,928 of gains and USD 6,042 of harms. Almost all of the gain comes from the better decisions the analysis makes possible. The AI computing behind it uses about 0.34 kWh of electricity and emits about 0.15 kg CO2e, which the method values at under three cents. Where an analysis replaces a consultant study that would have involved flights, it avoids 27 kg CO2e on average, although that figure rests on much weaker evidence than the footprint itself.
These are modeled figures. They value one analysis and the effects it is assumed to have, not outcomes observed at customers.
How the assessment was set up
The assessment takes the perspective of ViSoftware SA, the Swiss company that builds impactaccounting.ai, as the producer of one analysis. The functional unit is one organization-level analysis used for one decision about one company or project, called the position. A brief written for the software fixed that scope before the run, and the platform then generated the pathways, collected the evidence and valued each effect with the eQALY method, version 2.9.
The value chain follows from that perspective. The supply chain is the AI inference and cloud hosting bought to produce the analysis. Products and services covers what changes once the customer uses the analysis, compared with what the customer would have done without it. Own operations and end of life were in scope too, although the software did not find an effect large enough to model in either for a single analysis.
The counterfactual matters more than any other choice in an assessment like this one. Most customers are funds, foundations and investors that assess one position at a time, and few of them would pay EUR 15,000 to 50,000 for a consultant study of a single holding. The brief therefore assumes that three analyses in four replace a qualitative due diligence, such as an impact memo or a scorecard, and that one in four replaces a consultant-led valuation study.
From the first run to the calibrated model
The first run gave a net value of USD 1,489. Reading the model against the brief showed that the AI had stacked several cautious choices on top of each other, so the model was calibrated in the Model before this piece was written, as any customer would do. Each change is recorded with its reason in the model history and can be undone.
The largest change concerns the counterfactual of the decision. The first run assumed that 80% of the improvement would have happened without the analysis, even though its own inputs already counted only the decisions the analysis changed. The calibrated model sets that share to 25%, the share of analyses that replace a consultant study, because only there would the decision have been informed anyway. The analysis's share of a changed decision went from 20% to 50%, since an investment committee or a board still takes the decision. The size of a better decision is now tied to the brief's reference position, which has EUR 1 million a year of net valued impact, instead of a free-standing figure per person, and a decision steered the wrong way now has an effect of the same size.
The other changes are smaller. The share of analyses that replace a consultant study went from 5% to 25%, as in the brief. Two pathways valued the same electricity a second time and were removed. Three pathways for economic effects were removed as well, covering the consultants' lost income, the AI provider's income and the customer's review time. The brief excludes the first two because highly skilled people on both sides would hold equivalent jobs, and it treats the analyst's time as part of the cost of the analysis rather than as an impact. The token counts now follow the latest version of the analysis pipeline. Customers can make the same kind of correction in the Model, as the calibration guide shows.
The impact statement
The table shows the calibrated result for one analysis in the impact statement format, with gains as positive values and harms in brackets. Values are in US dollars, with cents shown for the lines that are smaller than a dollar.
| Pathway | Natural | Human | Social | Total |
|---|---|---|---|---|
| Supply chain | ||||
| AI computing electricity | (0.06) | +0.00 | +0.00 | (0.05) |
| Cloud computing electricity | (0.00) | +0.00 | +0.00 | +0.00 |
| Products and services | ||||
| Decision outcome gains | 0 | +60,297 | 0 | +60,297 |
| Misleading decision outcomes | 0 | (6,030) | 0 | (6,030) |
| Consultant study savings | 0 | +624 | 0 | +624 |
| Customer assessment payments | 0 | (12) | 0 | (12) |
| Avoided consultant flights | +6.87 | 0 | 0 | +6.87 |
| Project privacy distress | 0 | (0.01) | 0 | (0.01) |
| Net societal value | +6.81 | +54,879 | +0.01 | +54,886 |
The result is concentrated in one pathway. Decision outcome gains make up 90% of all the value the model moves in either direction, so the headline is only as reliable as the assumptions behind that pathway. The model's own range shows how open those assumptions still are, from a net loss of about USD 70,000 at the low end to a gain of about USD 5.5 million at the high end.
The harms are human rather than environmental. The largest by far is the risk that an analysis misleads a decision, valued at USD 6,030. The environmental footprint of the computing is the smallest line in the statement, about six orders of magnitude below the decision gain.
The method does not value money at face value. eQALY values a change in income by the change in well-being it brings to the people who receive it, and in this model one dollar kept or spent by the customer counts as about 11 cents of societal value. A saving of about USD 5,750 per analysis on consultant fees, which is a quarter of a EUR 20,000 study, therefore appears as USD 624. The price of the analysis counts for even less, because the customer receives the analysis in exchange and the model treats only 5% of the price as a net burden.
Where the value comes from
The decision outcome gains pathway carries the impact thesis of the software. An analysis is only worth something if it changes what happens to the people affected by the company or project it assesses, and the model values that change in a few steps.
The reference position affects about 1,000 people and has EUR 1 million a year of net valued impact, which is 18.5 eQALY a year at the method's value of USD 62,082 per eQALY. In 20% of analyses the decision changes, for example when capital moves to the option with more valued impact, a harm is cut before funding or impact targets are written into the term sheet. When it changes, the position's impact rises by 20%, which is 0.0037 eQALY per person each year. Over the five years the decision holds, that adds up to 3.7 eQALY before any adjustment.
The adjustments then keep about a quarter of it. A quarter of analyses replace a consultant study that would have informed the same decision, the analysis earns half of the credit for a changed decision, and 30% of the effect fades over the five years. That leaves 0.97 eQALY, or USD 60,297. Put more simply, one analysis is worth about 1.5% of the position's annual net valued impact for each year the decision holds, before the fade.
A mirror pathway uses the same structure for the risk that an analysis gets something wrong and pushes a decision the wrong way. The model assumes this happens in 2% of analyses, against 20% for a better decision, with an effect of the same size, which gives a harm of USD 6,030. Keeping the two pathways apart makes the downside visible instead of hiding it inside a net figure.
The size of the position matters more than any other number here. The decision gain scales linearly with the position's net valued impact, so an analysis of a company with EUR 5 million a year of valued impact carries five times the gain shown above, while its electricity use stays exactly the same. The societal value of an analysis therefore has to be read against what the analysis is about, and a reference figure like this one shows the structure of the result more than its size. The reference position and the share of decisions that change are assumptions, and no published study yet compares how often an impact valuation changes a funding decision with how often a qualitative due diligence does.
The environmental footprint of one analysis
Counting the electricity
The footprint of the software is almost entirely the electricity used to run AI inference in the provider's data centers. A typical analysis makes about 200 AI calls over an hour and a half, and each call carries a long context of about 22,000 input tokens. Public estimates are usually given per query, which does not fit this kind of work, so the team measured energy per token instead.
The method uses three energy factors taken from published studies, specifically 0.4 mWh per output token with reasoning included, 0.04 mWh per uncached input token and 0.004 mWh per cached input token. The factors cover the whole server and the data center overhead, and they assume modern data centers with production-scale batching. The main source is a peer-reviewed study by Microsoft Research (Oviedo et al., Joule, 2026), which also shows that widely cited per-query figures are four to twenty times too high because they were measured without batching.
On the latest version of the pipeline, measured over 12 completed runs, the factors give about 0.23 kWh for one run. Output tokens account for about two thirds of that energy, although they are fewer than one in ten of the tokens used. The model adds 50% for the chat and partial re-runs used while calibrating the model, which have not been measured yet, and arrives at 0.34 kWh per analysis. Cloud hosting in Frankfurt adds an estimated 0.05 kWh. The range in the model runs from 0.12 to 1.1 kWh, because it carries both the uncertainty in the energy factors and the uncertainty about how much calibration an analysis needs.
From electricity to carbon, water and nature
The software converts the 0.34 kWh with the ecoinvent 3.12 process for low-voltage electricity in the United States, where the AI provider runs its inference. That gives 0.15 kg CO2e per analysis, about 0.45 kg per kWh, and about 0.8 liters of water consumed. The water is used to generate the electricity, while the data centers themselves use closed-loop liquid cooling that evaporates almost nothing. The same process also produces 20 other indicators, from particulate matter and toxicity to land use and biodiversity.
In money, the natural capital cost of the AI electricity is about 6 cents per analysis. Climate change is just under half of it, at 2.7 cents, which reflects a value of about USD 180 per tonne of CO2e. Air pollution from power generation adds 2.1 cents and water pollution 0.7 cents. Electricity footprints often stop at carbon, while here the other effects together weigh slightly more than the carbon itself.
For everyday scale, one pipeline run of about 0.23 kWh is close to a working day of laptop use or boiling two liters of water in a kettle. A full analysis with its calibration uses about one and a half times that. One passenger on a short-haul flight emits about 100 kg CO2e, which is the footprint of more than 600 complete analyses.
Emitted and avoided, shown apart
In some cases an analysis also avoids emissions. When it replaces a consultant study, it avoids the flights the consultants would have taken for site visits. The model assumes that a displaced study involves about 800 passenger-kilometers of flights and that a quarter of analyses displace one, which gives 200 passenger-kilometers and 27 kg CO2e avoided per analysis on average. That is about 180 times the emissions of the computing.
The software reports the two sides next to each other and never nets them.
| Indicator | Emitted or used | Avoided |
|---|---|---|
| Climate change | 0.15 kg CO2e | 27.3 kg CO2e |
| Water consumption | 0.8 liters | 22.9 liters |
| Fossil resources | 0.05 kg oil-eq | 8.1 kg oil-eq |
| Particulate matter | 0.39 g PM2.5-eq | 22.4 g PM2.5-eq |
| Terrestrial biodiversity | 0.08 PDF·m²·year | 16.8 PDF·m²·year |
There are two reasons to keep them apart. The first is the quality of the evidence. The emitted figure comes from recorded token counts and published energy factors, while the avoided figure depends on how often an analysis really replaces a consultant study and whether that study would have involved flights, and neither has been measured yet. If no analysis replaced a consultant study, the avoided emissions would fall to zero and the footprint would stay exactly as it is. The second reason is that greenhouse gas accounting does not allow netting. Under the GHG Protocol, the electricity used for AI inference belongs in the inventory of ViSoftware as purchased services (Scope 3, category 1), and in the inventory of the customer in the same way, while avoided emissions are reported separately and are never subtracted from an inventory.
Notes for carbon accountants
The figure is location-based. It uses the average emission factor of the US electricity mix, which is the right basis for an impact valuation because it reflects the emissions that actually reach the atmosphere. A market-based figure, which credits the provider's purchases of renewable energy, would be about a third as large. The provider does not publish where or on which hardware it serves each request, so the model states its data center assumption openly. Modern hardware lowers the figure, and the share of older hardware still in service would raise it.
Some effects are left out. The training of the AI models and the manufacturing of the servers are not included, and together they would add an estimated 10% to 50% to the emissions of inference. The compute behind the provider's web search, the customer's own device and the network transfer are excluded as well. On the avoided side, the flight emissions use the standard 100-year warming potential and do not include the extra warming effect of aviation at altitude, which some carbon accounting guides add as a multiplier. None of these would change the conclusion, because the footprint of an analysis would have to grow about a million times before it came close to the value of the decision it informs.
That is the main lesson of this assessment for environmental accounting. The electricity of an AI analysis is real and worth measuring, and the method values it with the same care as every other pathway. The environmental effects that matter most, however, sit in the decisions the analysis informs, such as where capital goes and which harms are cut before funding. In this model the decision gain is valued only as a change in people's well-being, and an assessment written for an environmental fund would also value the emissions those decisions change.
What impactaccounting.ai has emitted so far
One analysis is a small unit, so it helps to look at the platform as a whole. An estimated 2,000 to 3,000 analyses have run on impactaccounting.ai so far, counting customer work, tests and the evaluations used to check the method. Applying today's figure of 0.23 to 0.34 kWh per run to all of them, including earlier versions of the pipeline, gives roughly 450 to 1,000 kWh of electricity and 0.2 to 0.5 tonnes of CO2e in total.
That is about the same as one passenger taking two to five short-haul flights. It is also about the footprint of producing two to five kilograms of beef, which comes to roughly 100 kg CO2e per kilogram when the meat comes from a beef herd (Poore and Nemecek, Science, 2018). For a platform that has produced thousands of analyses, the climate cost of the computing itself is small, and it is far smaller than the effects of the decisions those analyses inform.
Small is not zero, and the number will grow with the platform. We will keep measuring it, report it alongside our results and look for ways to bring it down as usage scales.