

Tutorial
The eQALY method: value your first impact
Break any business activity into its four building blocks and compute the societal value of a single job, step by step. Everything the software does at scale follows the same logic.
What you will learn
By the end of this tutorial you will be able to explain what the eQALY method is, break any business activity down into its four building blocks, and understand where value factors enter the calculation. We will practice on one concrete case, a job created in a factory, and compute its societal value step by step. Everything the software does at scale follows the same logic you will apply here manually.
Why impact valuation needs a common unit
Every business decision, whether it is an investment, a sourcing choice, or a product design, creates effects on people and nature that financial accounts do not capture. A company might pay wages, emit greenhouse gases, train workers, and pay taxes all at once. Each of these matters, and each is usually measured in a different unit. Wages come in dollars, emissions in tonnes, training in hours. As long as they stay in different units, they cannot be compared or added up, and sustainability remains a list of disconnected indicators.
Impact valuation solves this by translating every effect into one common, monetized unit. Once everything is expressed in the same unit, a CFO or a board can weigh a tonne of CO2 against a living wage gap, or a training program against a tax contribution, the same way they weigh line items in a financial P&L.
The eQALY method uses a unit grounded in human well-being. One eQALY, or equivalent Quality-Adjusted Life Year, represents one year of life in good health. Every impact, positive or negative, across natural, human, and social capital, is expressed as a gain or loss of healthy life years. To make results comparable with financial figures, each eQALY is then monetized at the Social Value of Life (SVL), which is USD 62,082 per eQALY in the 2026 release, based on the 2024 OECD population-weighted average GDP per capita in purchasing power parity. Importantly, this value is the same in every country. A year of healthy life is worth the same whether it happens in Switzerland or in Guatemala, which reflects the principle that all lives have equal value.
The key equation
Every valuation in the eQALY method, without exception, comes from the same equation.
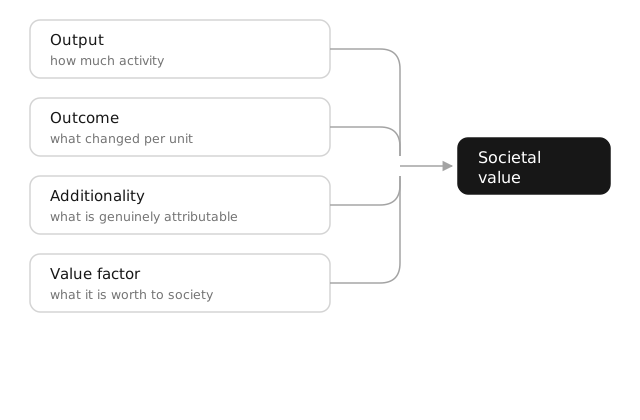
Societal value = Σ ( Output × Outcome × Additionality × Value factor )
Let us unpack each term, because once you understand these four, you understand the whole method.
Output is the measurable quantity of activity. It answers the question of how much happened. Examples include the number of employees, the tonnes of CO2 emitted, the hours of training delivered, or the dollars of taxes paid. Outputs are things a company can count from its own records.
Outcome is the change that each unit of output causes in the world. A wage paid changes someone's income. A tonne of particulate matter causes a measurable amount of ill health. An hour of training raises future earning capacity. Outcomes usually come from evidence, such as payroll data, scientific studies, or life cycle assessment databases.
Additionality answers the hardest question in impact measurement, which is how much of the outcome the activity genuinely caused. It combines three corrections. The baseline asks what would have happened anyway without the activity. The drop-off asks how quickly the effect fades over time. The attribution asks what share belongs to this actor rather than to co-investors or other causes. Multiplied together, these give a percentage between 0 and 100 that scales the outcome down to what was truly caused.
Value factor is the conversion step. It translates the adjusted outcome into eQALYs, and from there into money via the SVL. This is where the method's published datasets come in. The value factors are country-specific, which means the same dollar of income or tonne of pollutant is valued differently depending on where it lands, as we will see below.
The Σ (sum) sign matters too. Most activities cause several outcomes at once, so the total societal value of an activity is the sum of this equation applied to each of its outcomes.
The four-step architecture, open above, fixed below
The equation tells you what to calculate. The architecture tells you how to structure any case you encounter. It works as a four-step flow.
- Impact driver (open). Start from the activity that produces societal effects. A job created, a tonne emitted, a product sold, a program delivered. This step is fully open, meaning any activity of any organization in any sector can be a driver. This is why the method can cover 100% of possible activities. You are never limited to a predefined list.
- Outcomes (open, one to many). Identify the changes the driver causes. This step is also open. The analyst decides which outcomes are material and can add or remove outcomes as the case requires. A job might produce five or seven outcomes. A donation might produce two.
- Pathway (template, 1 of 7). Each outcome is routed through one of seven reusable valuation pathways. Three cover human capital, namely health and well-being (WB), income and wages (IW), and education and skills (EST). Two cover social capital, namely taxes (T) and avoided costs to society (SC). Two cover natural capital, namely environmental externalities (EE) and ecosystem services (ES). Whatever outcome you identified in step 2, it fits one of these seven templates.
- Value factor (fixed, 1 of 4). Each pathway resolves to one of four base value factors. HUI, the Health Utility of Income, converts a dollar of personal income into healthy life years, with country-specific values for 266 countries and territories. HUT, the Health Utility of Taxes, does the same for a dollar of public spending, adjusted for governance quality. SVL, the Social Value of Life, prices direct health effects. NatCap value factors cover 17 environmental indicators such as climate change, water use, and land use, regionalized by country.
Notice the asymmetry. The top of the chain is open, so the assessment adapts to any activity. The bottom is anchored to a small, stable set of factors, so every result lands in the same unit and stays comparable across topics, sectors, and countries. This combination of flexibility above and consistency below is the core advance of the method.
Now let's value a job
Time to practice. Imagine a company creates one full-time job in a garment factory, paying USD 4,800 per year in a country where the living wage benchmark is USD 6,000. We will walk the four steps together.
Step 1) the driver. Our impact driver is employment, one job created.
Step 2) the outcomes. A job changes several things at once. For this exercise we will assess four outcomes. The worker receives a wage. The wage falls short of the living wage, creating a gap. The employer and employee pay taxes. The worker faces some occupational safety risk. A full assessment could add more, such as training received or the sense of dignity from work, and that is exactly the point. The outcome list is yours to extend.
Step 3) the pathways. The wage and the living wage gap both route through the income pathway (IW). The taxes route through the tax pathway (T). The safety risk routes through the health and well-being pathway (WB).
Step 4) the value factors. IW resolves to HUI for that country. T resolves to HUT. WB resolves to SVL.
Now apply the equation to the wage outcome, using illustrative numbers for the factors.
| Term | Value |
|---|---|
| Output | 1 employee |
| Outcome | USD 4,800 of income received per year |
| Additionality | 60% — the baseline analysis shows a 40% chance of finding a similar job anyway |
| Value factor | 0.00003 eQALY per USD of income (illustrative HUI for this country) |
Societal value of the wage = 1 × 4,800 × 0.60 × 0.00003 = 0.086 eQALY, which monetized at the SVL of USD 62,082 gives roughly USD 5,360 of societal value per year.
The living wage gap works the same way but with a negative sign, since the USD 1,200 shortfall represents well-being the worker should have but does not. The taxes flow through HUT, where a dollar of public spending in a well-governed country buys more health and education than in a poorly governed one. The safety risk converts expected injury rates into lost healthy life years, priced directly at the SVL. Add the four results together and you have the net societal value of that job. That sum is the Σ in the equation.
Two things are worth noticing in this exercise. First, the same dollar is worth more well-being in a poorer country, because HUI and HUT carry diminishing marginal utility by design. Equity is built into the structure of the method, not added afterwards. Second, every number in the chain is visible and adjustable. If the wage changes, or the country changes, or better baseline evidence appears, you update one parameter and the result updates with it.
Why this beats a single coefficient
Common practice in the field publishes one bundled value factor per topic, such as one dollar figure per job created or per case of child labor. That is convenient, but it locks the wage, tax, training, and safety assumptions inside a single number that cannot be adapted to the role, the country, or the worker. The eQALY method decomposes the chain instead. The result is flexibility, since pathways can be added or removed per case, granularity, since every parameter is country-specific, transparency, since every number traces back to public datasets such as the Global Burden of Disease and ILO statistics, and comparability, since everything still converges on the same four base factors and the same unit.
A striking consequence is that employment and child labor, usually treated as unrelated topics, turn out to be the same set of outcomes with different parameter values. Same architecture, different signs and magnitudes. Once you can decompose one driver, you can decompose any of the 30+ drivers the method covers, and any new one your situation requires.
What you learned, and what comes next
You can now break any activity into driver, outcomes, pathways, and value factors, and you have applied the key equation to a real case. You also know where the value factors sit in the chain and why the open-above, fixed-below design lets one method cover every activity while keeping results comparable.
A single valued driver is powerful, but decisions usually need the full picture across a whole organization. To see how many pathways combine into an Impact Statement, a one-page view of an organization's societal value across all three capitals and the entire value chain, read the Impact Statement framework.
To put the method to work on a real organization, see Assessing an organization. For how the software applies this at scale, see How ImpactAccounting.ai works.