

Tutorial
Assessing an organization: start-up, non-profit or business
Run a full impact valuation of an organization starting from nothing more than a company name, then find your way around the Model and Insights views.
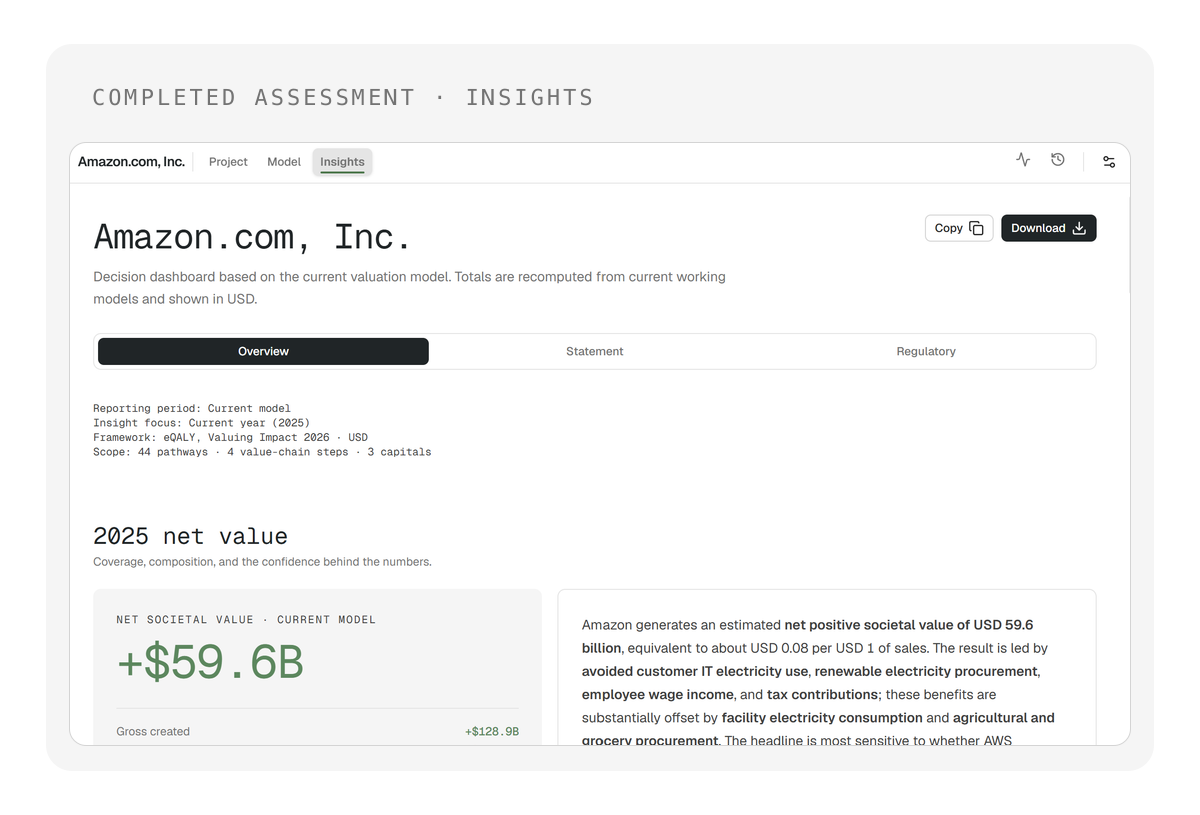
In this tutorial, you will run a full impact valuation of an organization using impactaccounting.ai, starting from nothing more than a company name. By the end, you will have a completed impact statement with detailed pathway-level results and an insights summary for decision-makers, and you will know your way around the Model and Insights views. Whether you are assessing a start-up, a non-profit or a large business, here is how to get there, step by step.
Launch an analysis
Step 1) Find the organization
Open impactaccounting.ai. Type the company name in the search field.
The software looks up the website, activity sector and geography of matching organizations. A list of results appears.
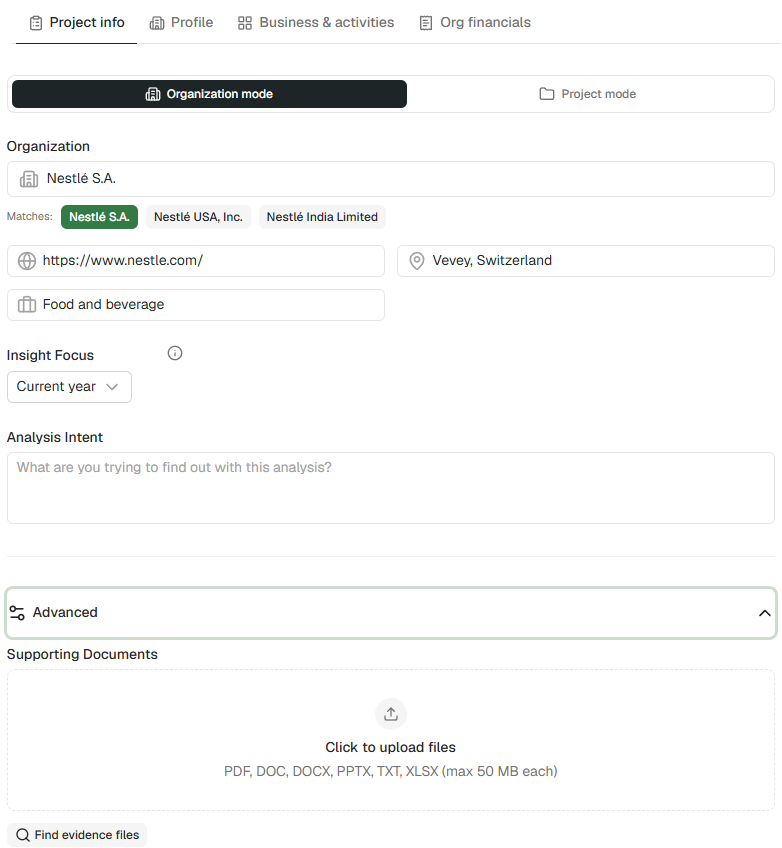
Step 2) Select the organization
Click on the organization you want to assess. The project setup screen now appears with the organization name, website and sector pre-filled.
If you only want to assess a subsidiary, product or investment rather than the full organization, use Project mode instead. See Assessing and comparing investments, projects or programs.
Step 3) Configure the analysis
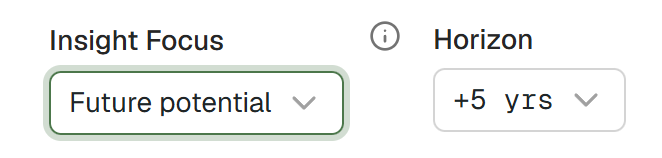
Set the analysis to Current year or Future potential.
Use Current year for established organizations with current operations.

Use Future potential for early-stage organizations such as start-ups, and set a time horizon from 1 to 10 years.
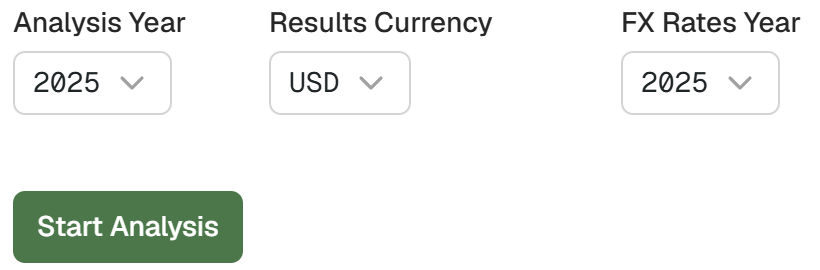
Set the currency and reference year. Optionally, upload supporting documents such as annual reports or sustainability disclosures.
The selected settings and uploaded documents now appear on the project setup screen.
The software uses uploaded documents as background data, not as direct instructions. Do not include requests for specific analysis scope or behavior in these files.
Step 4) Start the analysis
Click Start Analysis. The processing screen appears. The analysis takes roughly 30 minutes.
Track the analysis progress
Click the logo in the top-right corner to follow the progress of the processing.
The processing view opens and shows the status of the analysis. When the processing is complete, you receive a confirmation email with a link back to the project page.
Open the Model and Insights views
Open the completed project. In the top menu, you see three tabs: Project, Model and Insights.
Click Model first. This is the analyst view: it shows the full pathway-level results, data challenges, scenarios and the financial value connection.
Now click Insights. This is the decision-maker view: it summarizes the results with a focus on risks, opportunities, the impact statement and regulatory alignment.
You will explore both views in the sections below.
Explore the Model
Click the Model tab. The full impact statement appears, organized pathway by pathway and categorized by value-chain step.
Explore the Model sub-menus
In the sub-menu at the top, you see four options.
Click Valuation. This shows the base valuation results.
Now click Data challenges. The software has automatically identified the variables and data points with the highest uncertainty and the biggest contribution to the final result. These are the areas where better data would most improve the model.
Now click Scenarios. This is where you can create different versions of the same model by changing selected assumptions. For a full guide on creating, checking and interpreting scenarios, see Building scenarios.
Finally, click Financial value. This analysis runs on demand and connects impact pathways to business value using the ROImpact Canvas method.
The selected analysis appears in the Model view each time you move between the four options.
Explore the filters and supporting data
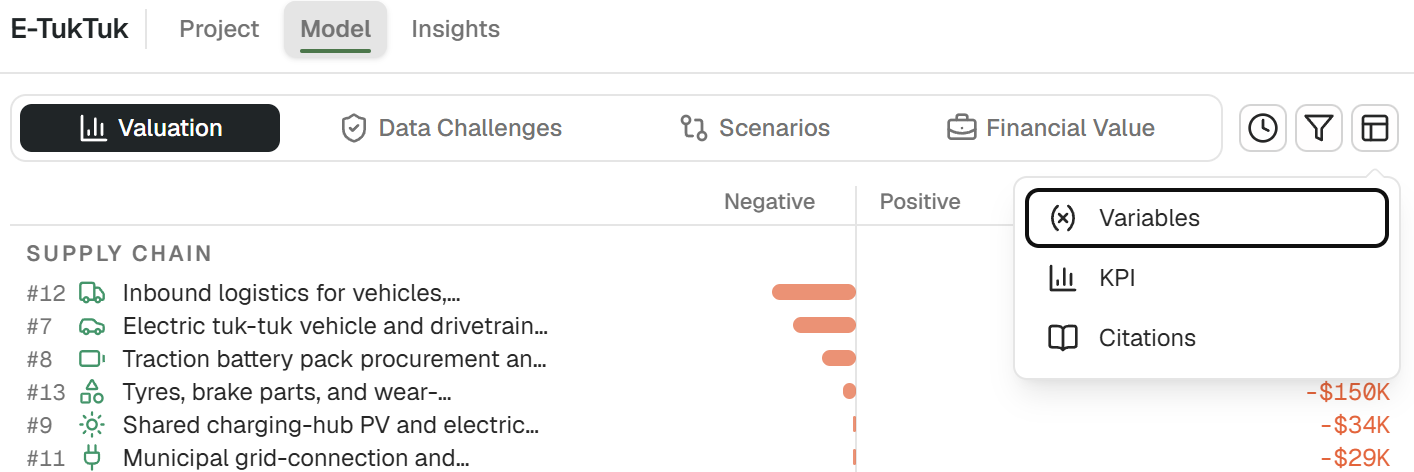
Notice the funnel icon at the top right. This opens filters on the results. The clock icon gives access to scenario impact statements.
Further tabs show:
- the full list of variables with sources;
- the KPIs, including SROI and IMOIC ratios; and
- the citations for all data sources used.
Clicking each icon or tab opens the corresponding filters, statements or supporting data.
Explore a pathway
Now let's explore a single pathway. Click on any pathway in the list. A pop-up window appears showing the full modeling detail.
Notice the pathway type in the top-left corner. Below it, you see how duration is handled: flow, capex or long-duration effect.
The description of the activity appears next, with the output and outcome variables below. Further down are the actual values and the final societal value.
Click on any variable. The variables tab opens below with that variable highlighted, showing the data source and the reasoning behind it. The small (i) icons to the right of the numbers provide additional justification.
The modeling follows the eQALY impact valuation method. For a full explanation of the methodology and the societal impact equation, see The eQALY method: value your first impact.
By default, societal impact is calculated as:
Societal impact = Output × Outcome × Additionality × Value factor
where Additionality = baseline × (1 − drop-off) × attribution
Click open inspector for the full detail on any pathway.
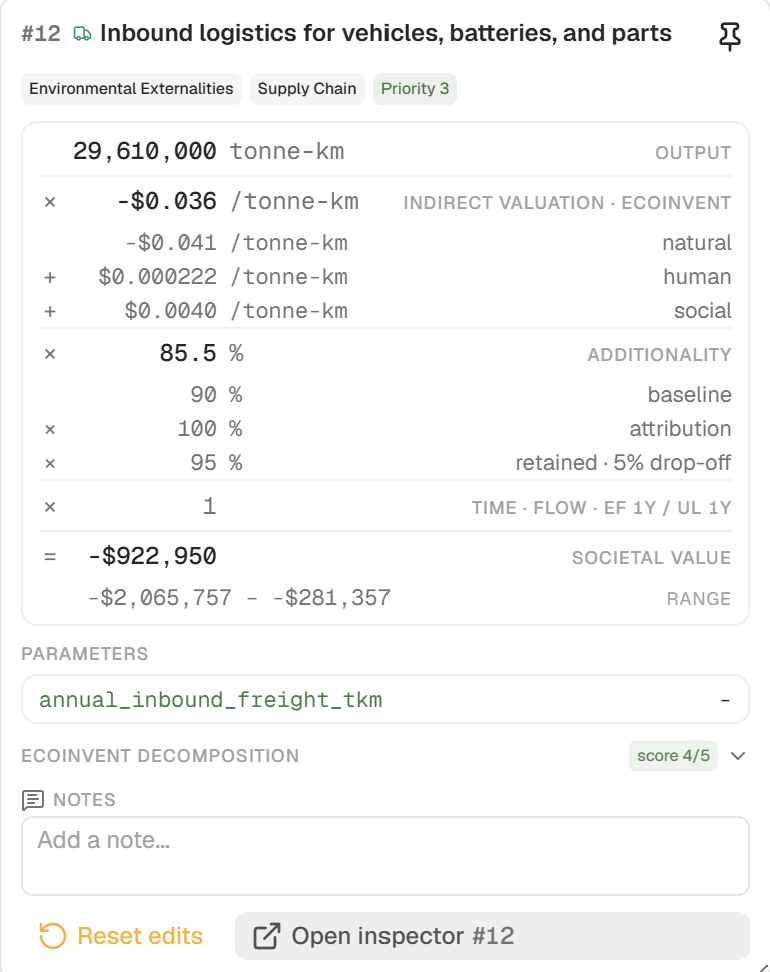
The pathway inspector opens. From here, you can also delete or duplicate a pathway if needed.
Explore the Insights
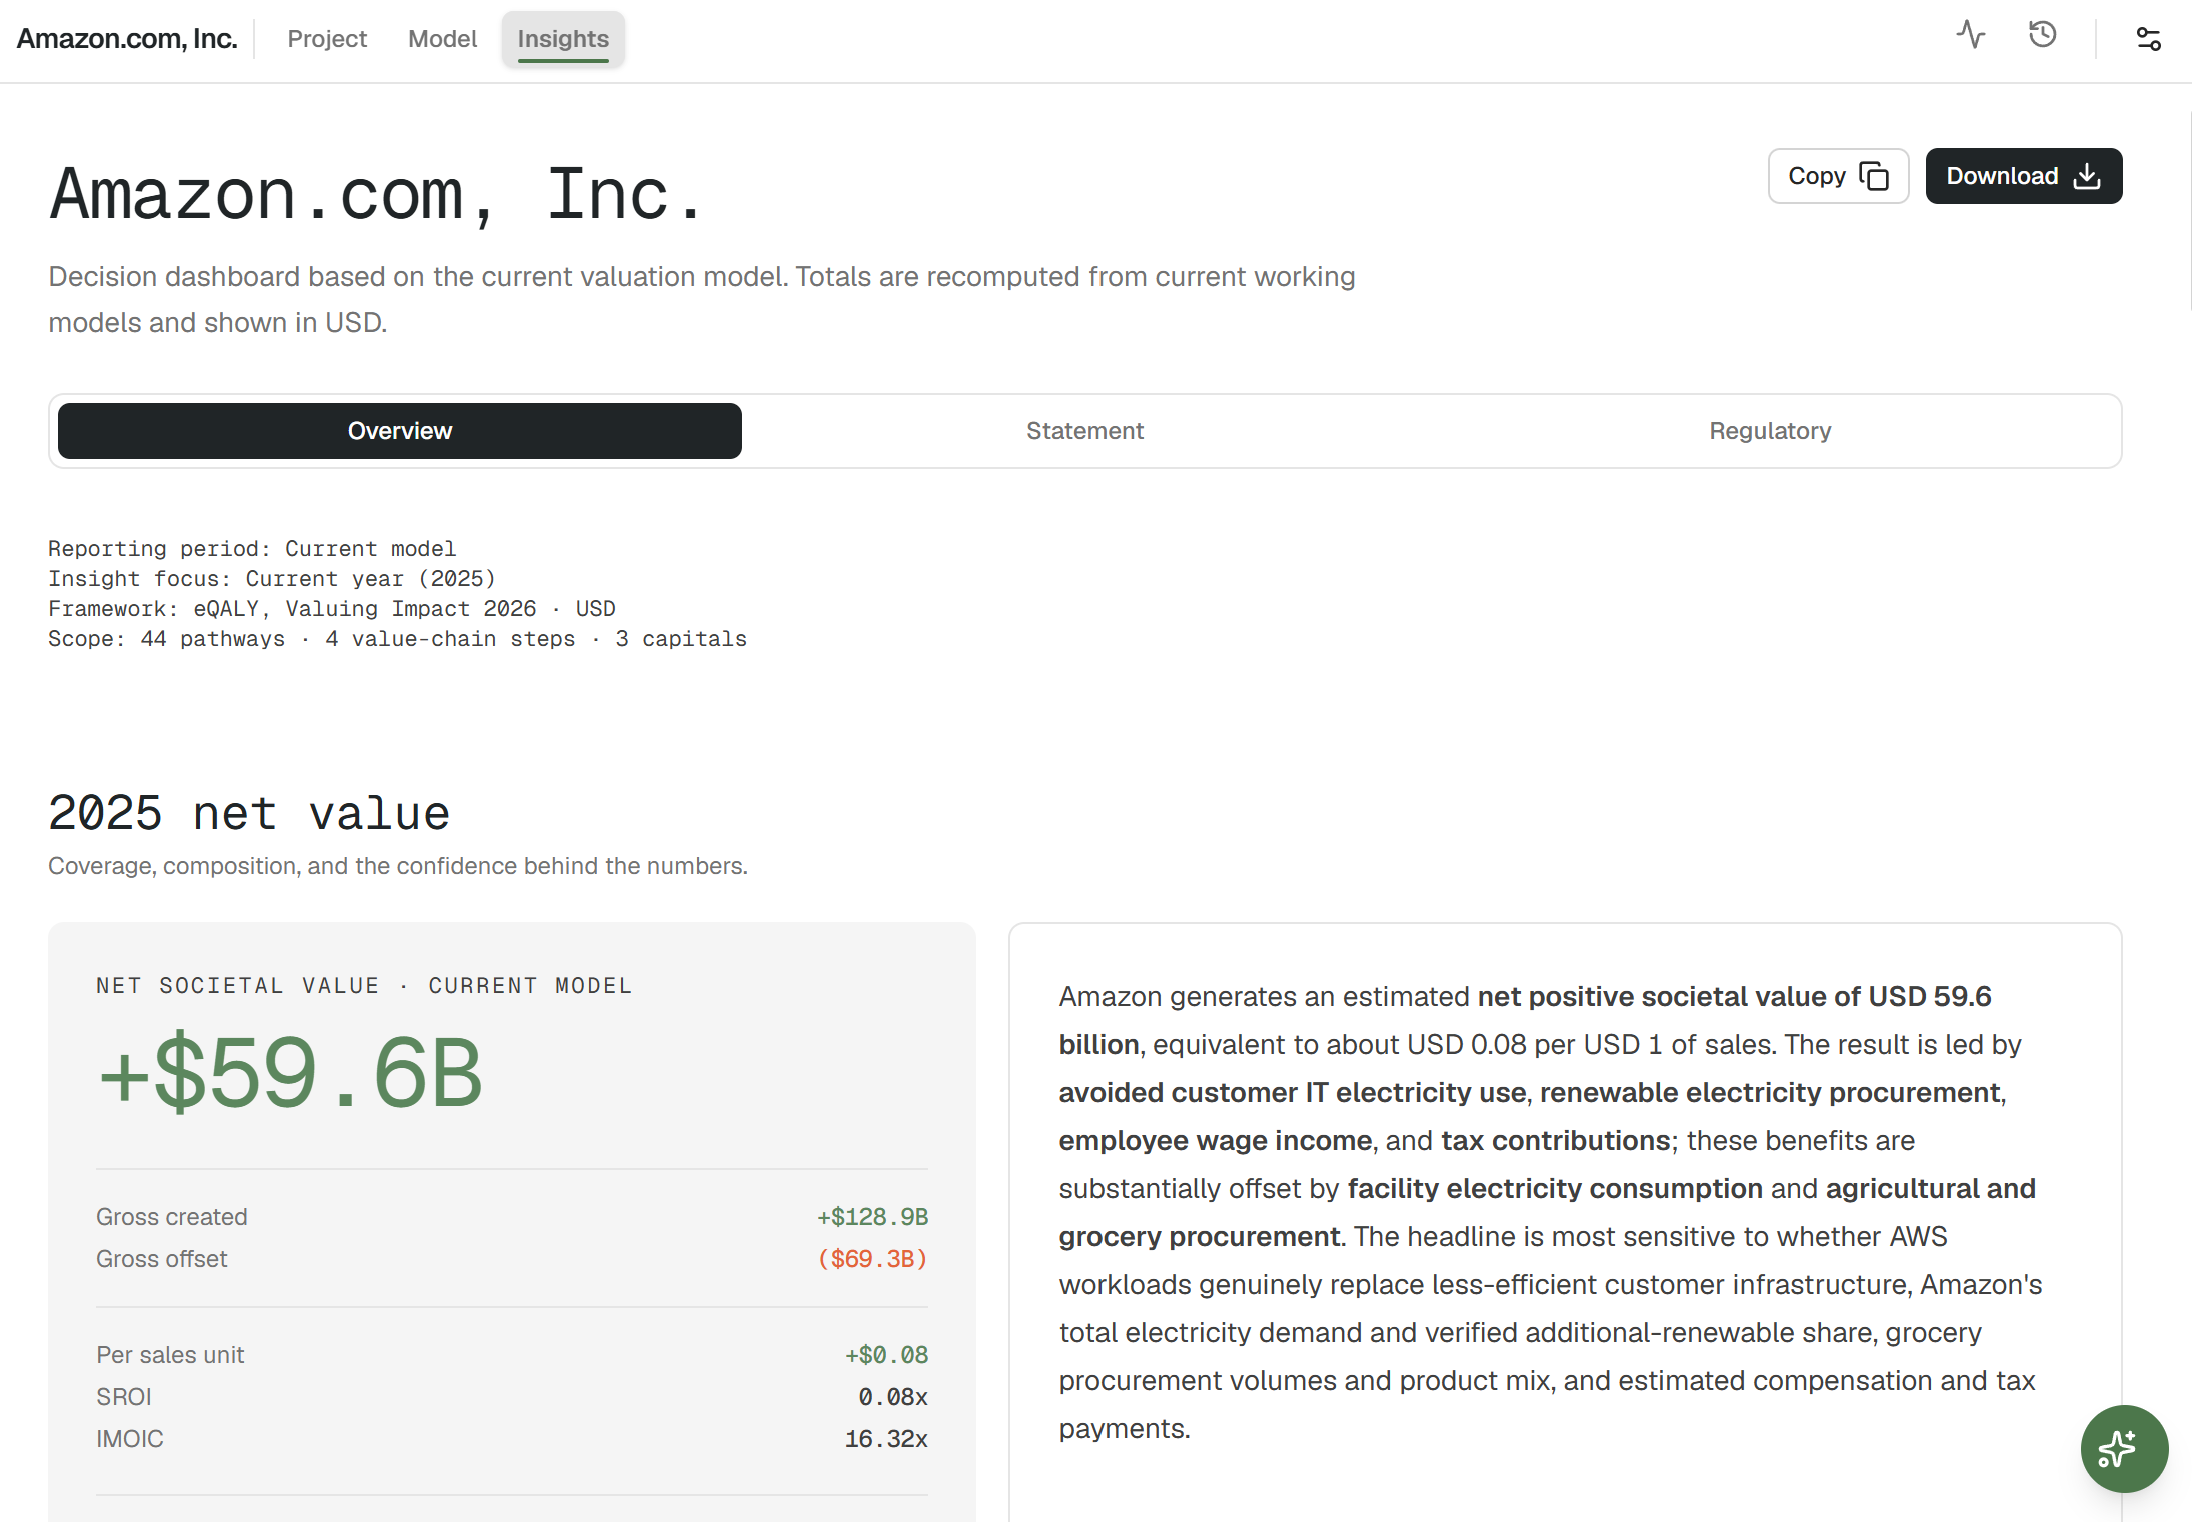
Click the Insights tab.
The page opens with the top-line results of the analysis. Below, you see a breakdown of the biggest pathway contributions, the main data gaps, risks and opportunities, a future outlook, and a summary of where to focus next.
Scroll through the page to see the full picture.
Export the results
Click the Download button at the top right of the screen. The following pop-up opens:
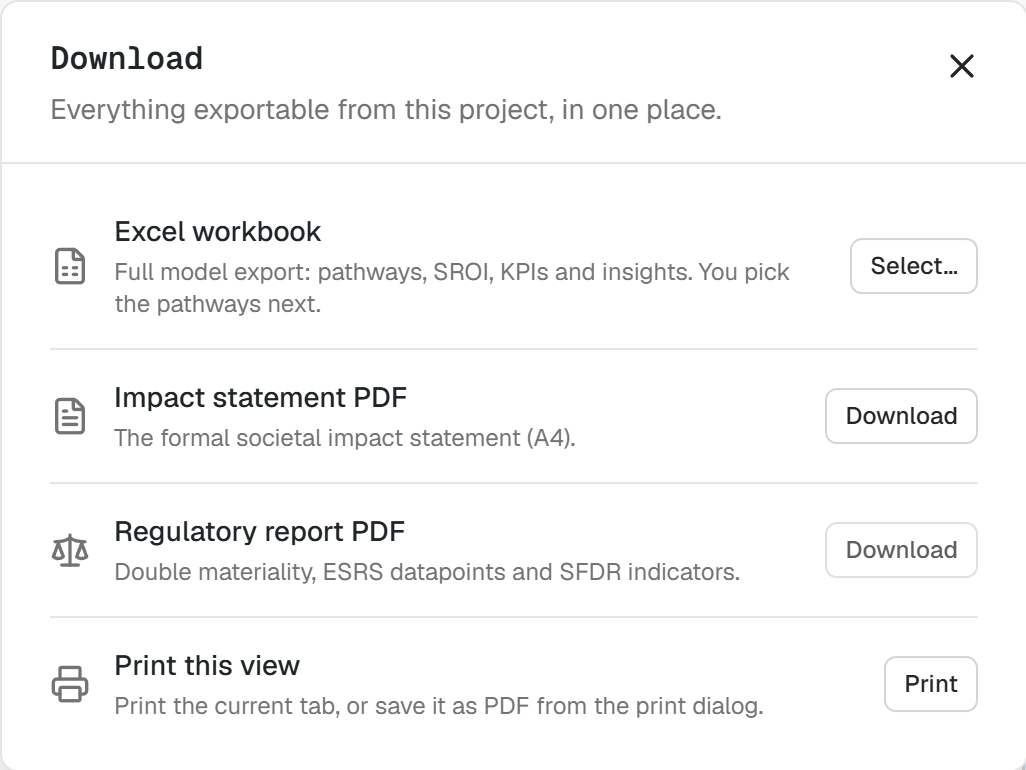
The pop-up offers an Excel workbook with the full data behind the calculations, an impact statement PDF for review and reporting, and a regulatory report PDF covering scope, methodology, assumptions and limitations. A separate Regulatory sub-tab generates double materiality, CSRD/ESRS and SFDR outputs on demand.
For what each output contains and when to use it, see Exporting results and regulatory outputs.
Build a portfolio
Once you have a completed assessment, you can repeat the process for other organizations and build a portfolio within one workspace. One workspace equals one portfolio: the workspace view compares every assessment side by side, lets you weight each holding by ownership percentage, and exports the whole set for external analysis in a tool such as Claude Cowork.
Two functions support portfolio-level analysis: the workspace overview and the workspace data bundle.
Open the portfolio view
Click on the workspace name. The portfolio view opens, showing a benchmark table comparing all assessments in the workspace.
You can share this view using the button at the top right, and adjust the weighting by clicking edit details and setting each organization's percentage contribution. The weighting fields appear, and the portfolio results update once you apply the percentages. A toggle switches between the unattributed and weighted portfolio views.
Download the portfolio data
Click the three dots next to the workspace name and select Download workspace data bundle to save the full portfolio data locally.
The download contains a README, a methodology document, field-level schemas and analysis scripts that allow tools such as Claude Cowork to navigate and interpret the content. From there, you can build custom dashboards, extract specific results on greenhouse gases, biodiversity or employment, or prepare board memos and data-collection requests.
For a full tutorial, see Building a fund or portfolio assessment.
What comes next?
You now have a completed impact valuation, from a company name to a full impact statement with pathway-level detail and an insights summary.
- To assess individual projects or investments rather than full organizations, see Assessing and comparing investments, projects or programs.
- To test different assumptions within a completed model, see Building scenarios.
- To export the results or generate CSRD and SFDR outputs, see Exporting results and regulatory outputs.
- For how the analysis works under the hood, see How ImpactAccounting.ai works.