

Product update
Everything we shipped this summer, and what you can do with it
Six things you can do now that you could not in March — and the full changelog behind them.
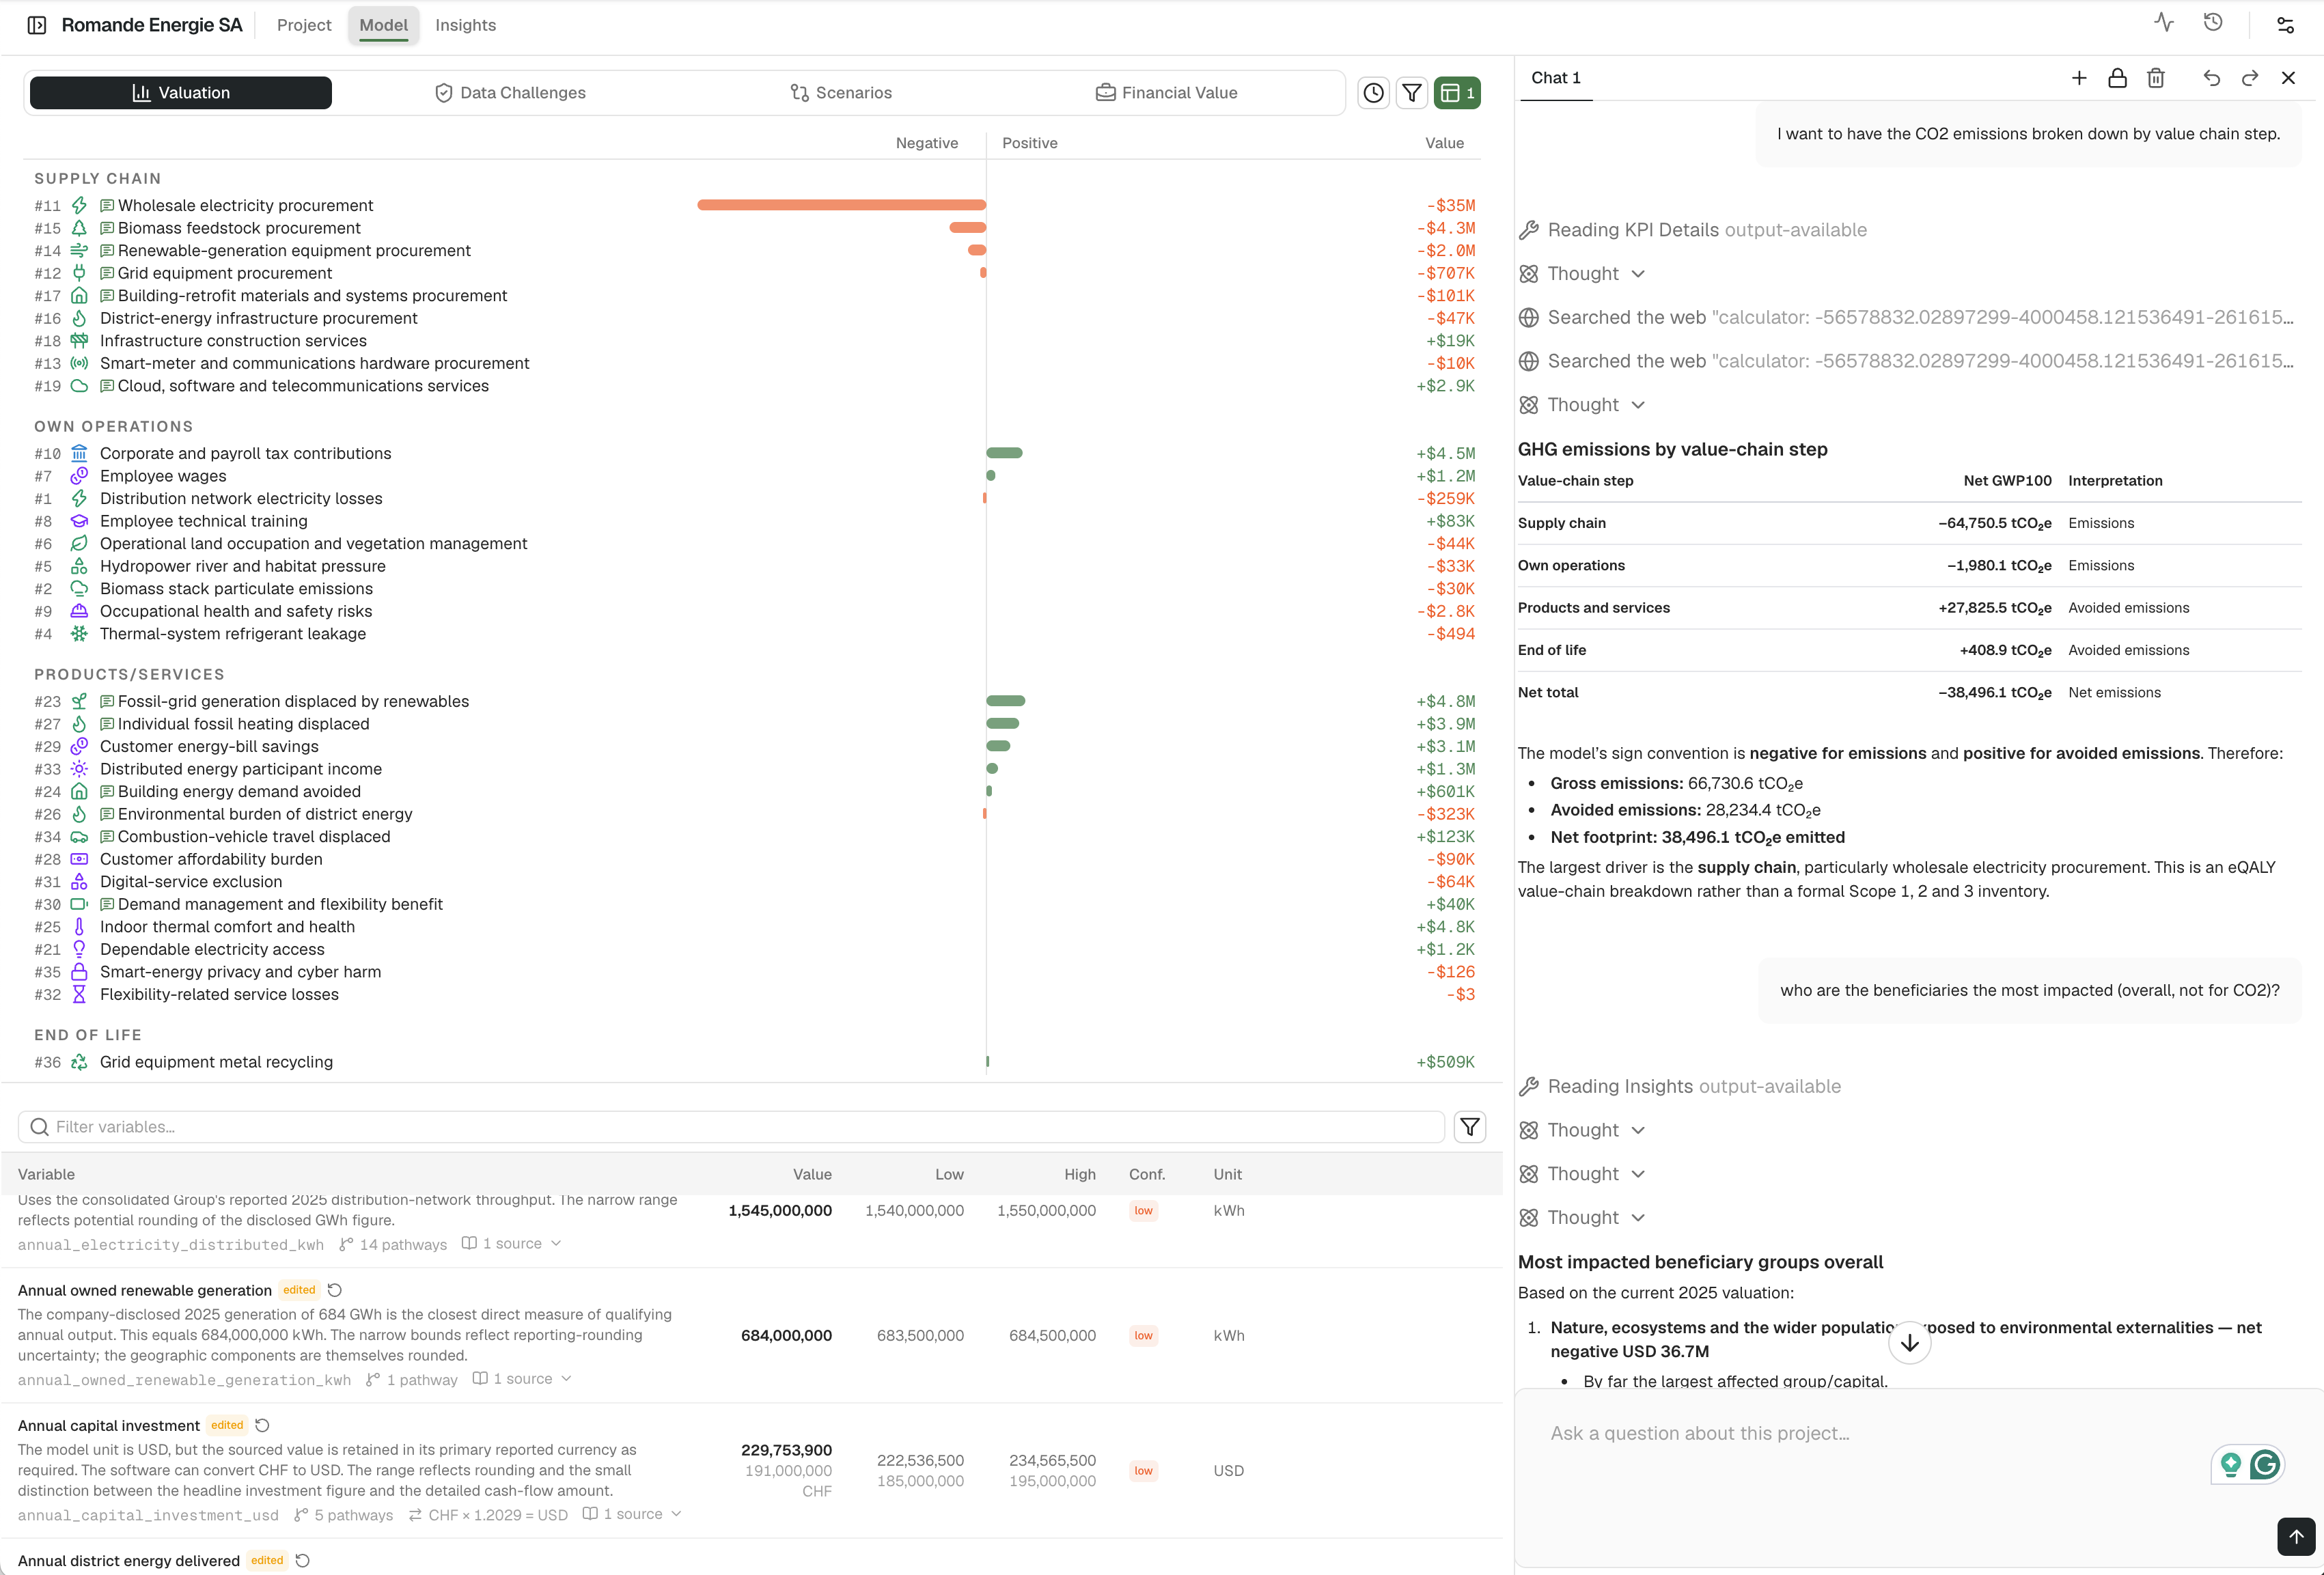
The platform changed a lot between March and August. Rather than list the features, this post walks through what you can now do with them, because every one of these shipped in response to the same handful of goals our users keep bringing us. If one of these goals is yours, the section is your starting point, and the appendix at the end lists everything else that shipped along the way.
More than 50 organizations run on the platform every week. Most users are touching a fraction of what is described below.
Goal 1 · Walk into the board meeting with the whole portfolio on one page
The workspace portfolio was rebuilt from the ground up. Clicking your workspace name now opens a single page with quick-jump navigation, one combined results table across every holding, and a stronger company benchmark, so each position reads against the rest of the portfolio instead of floating alone. The same layout is mirrored on the public share page, and the share dialog was simplified, so publishing a private link for your investment committee, board or LPs takes one step.
The portfolio view covers impact totals, capital breakdowns, geography, benchmarking, forecast scenarios, risk signals, opportunities and data-quality issues across projects. It is the difference between assembling a board pack and opening one.
💡 Try it in one minute: Click your workspace name, then use the share dialog to generate a private link and send it to yourself.
For the full walkthrough, see Building a fund or portfolio assessment.
Goal 2 · Ask the portfolio a question and trust the answer
Two releases this summer change how you interrogate results.
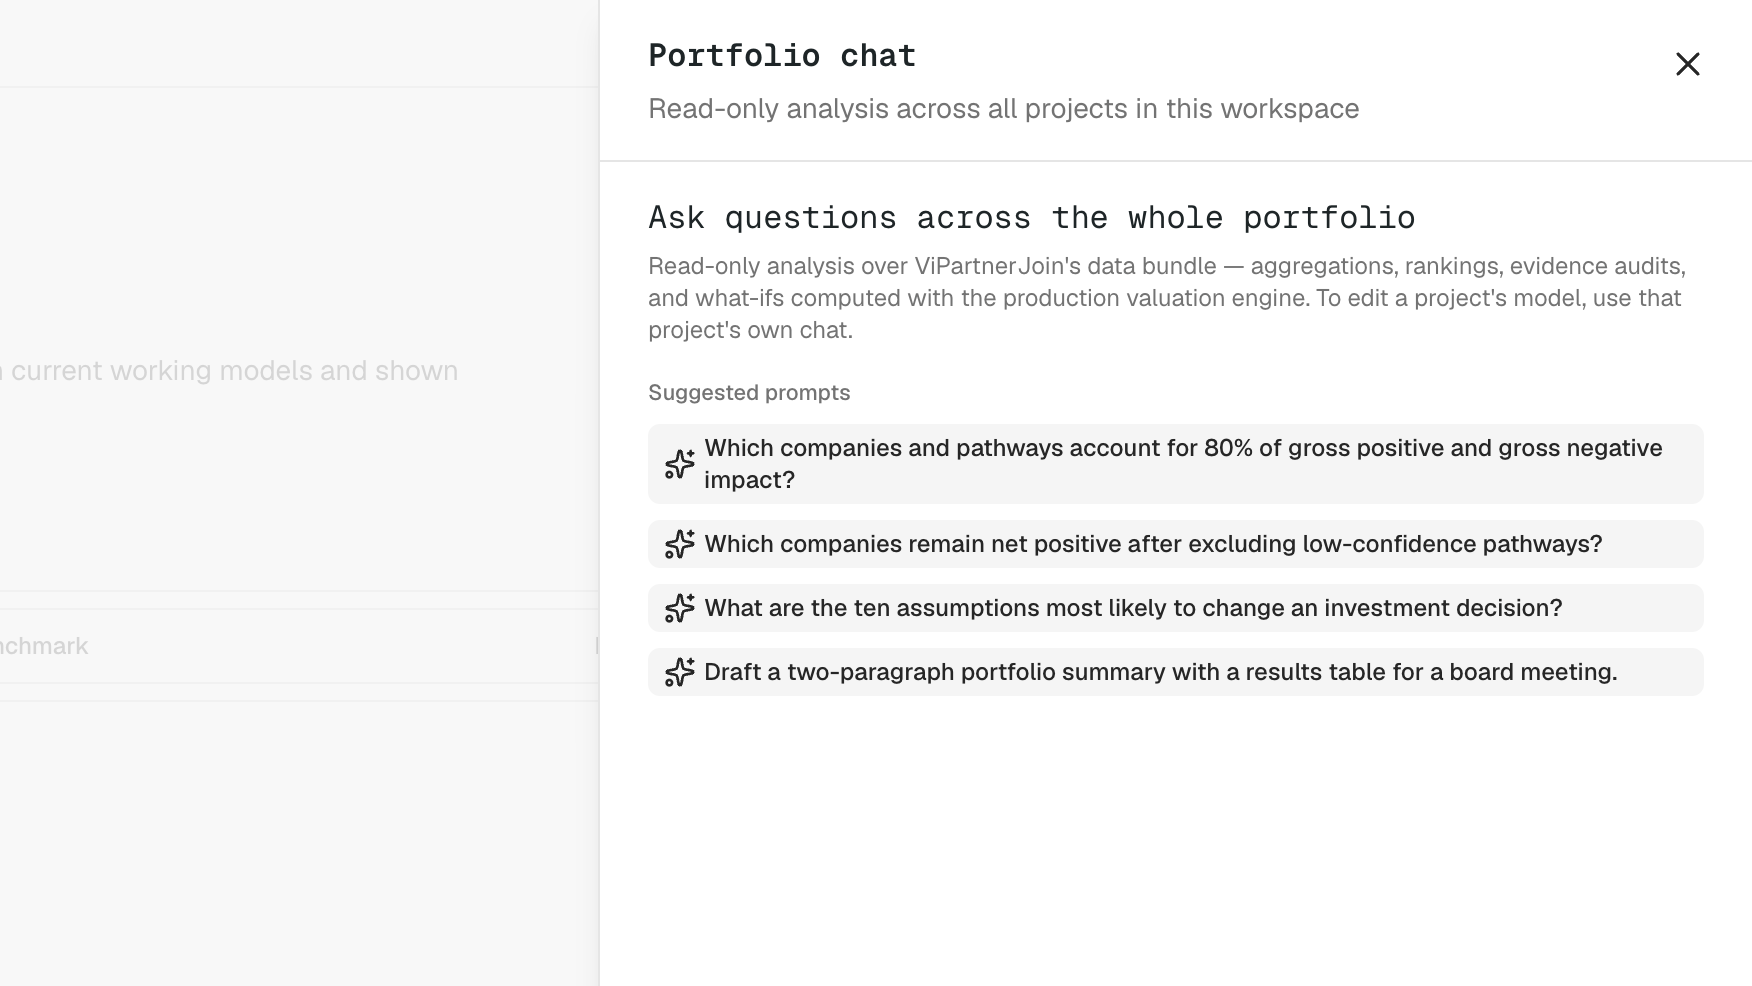
Workspaces now have a read-only Portfolio chat that answers questions across every project at once, covering totals, comparisons, evidence and confidence. Ask it which companies and pathways account for 80% of gross negative impact, which holdings stay net positive after excluding low-confidence pathways, or which ten assumptions are most likely to change an investment decision. It can also draft a two-paragraph portfolio summary with a results table for a board meeting. Because it is read-only by design, exploratory analysis can never silently rewrite an underlying assessment; model edits happen in each project's own chat.
Just as important is what sits underneath. Project chat now runs calculations directly against a full export of your project, using the same data and valuation engine behind the workbooks. Breakdowns, cross-checks and totals come from the model rather than from an estimate, and the data refreshes automatically after you edit. When the chat gives you a number, it is the model's number.
💡 Try it in one minute: Open Portfolio chat and ask which companies and pathways drive 80% of your gross negative impact.
Goal 3 · Show where impact is heading, not just where it stands
Every project is now modelled on the current year and also gets a future view at its horizon, and you switch between the two frames directly on the Insights dashboard, labelled with real years, for example Current · 2025 and Future · 2030. Risks, opportunities and data gaps are shared across both frames, tagged by the horizon at which they bite. The old Insight Focus setting is gone, and the horizon moved to advanced settings as Future Horizon.
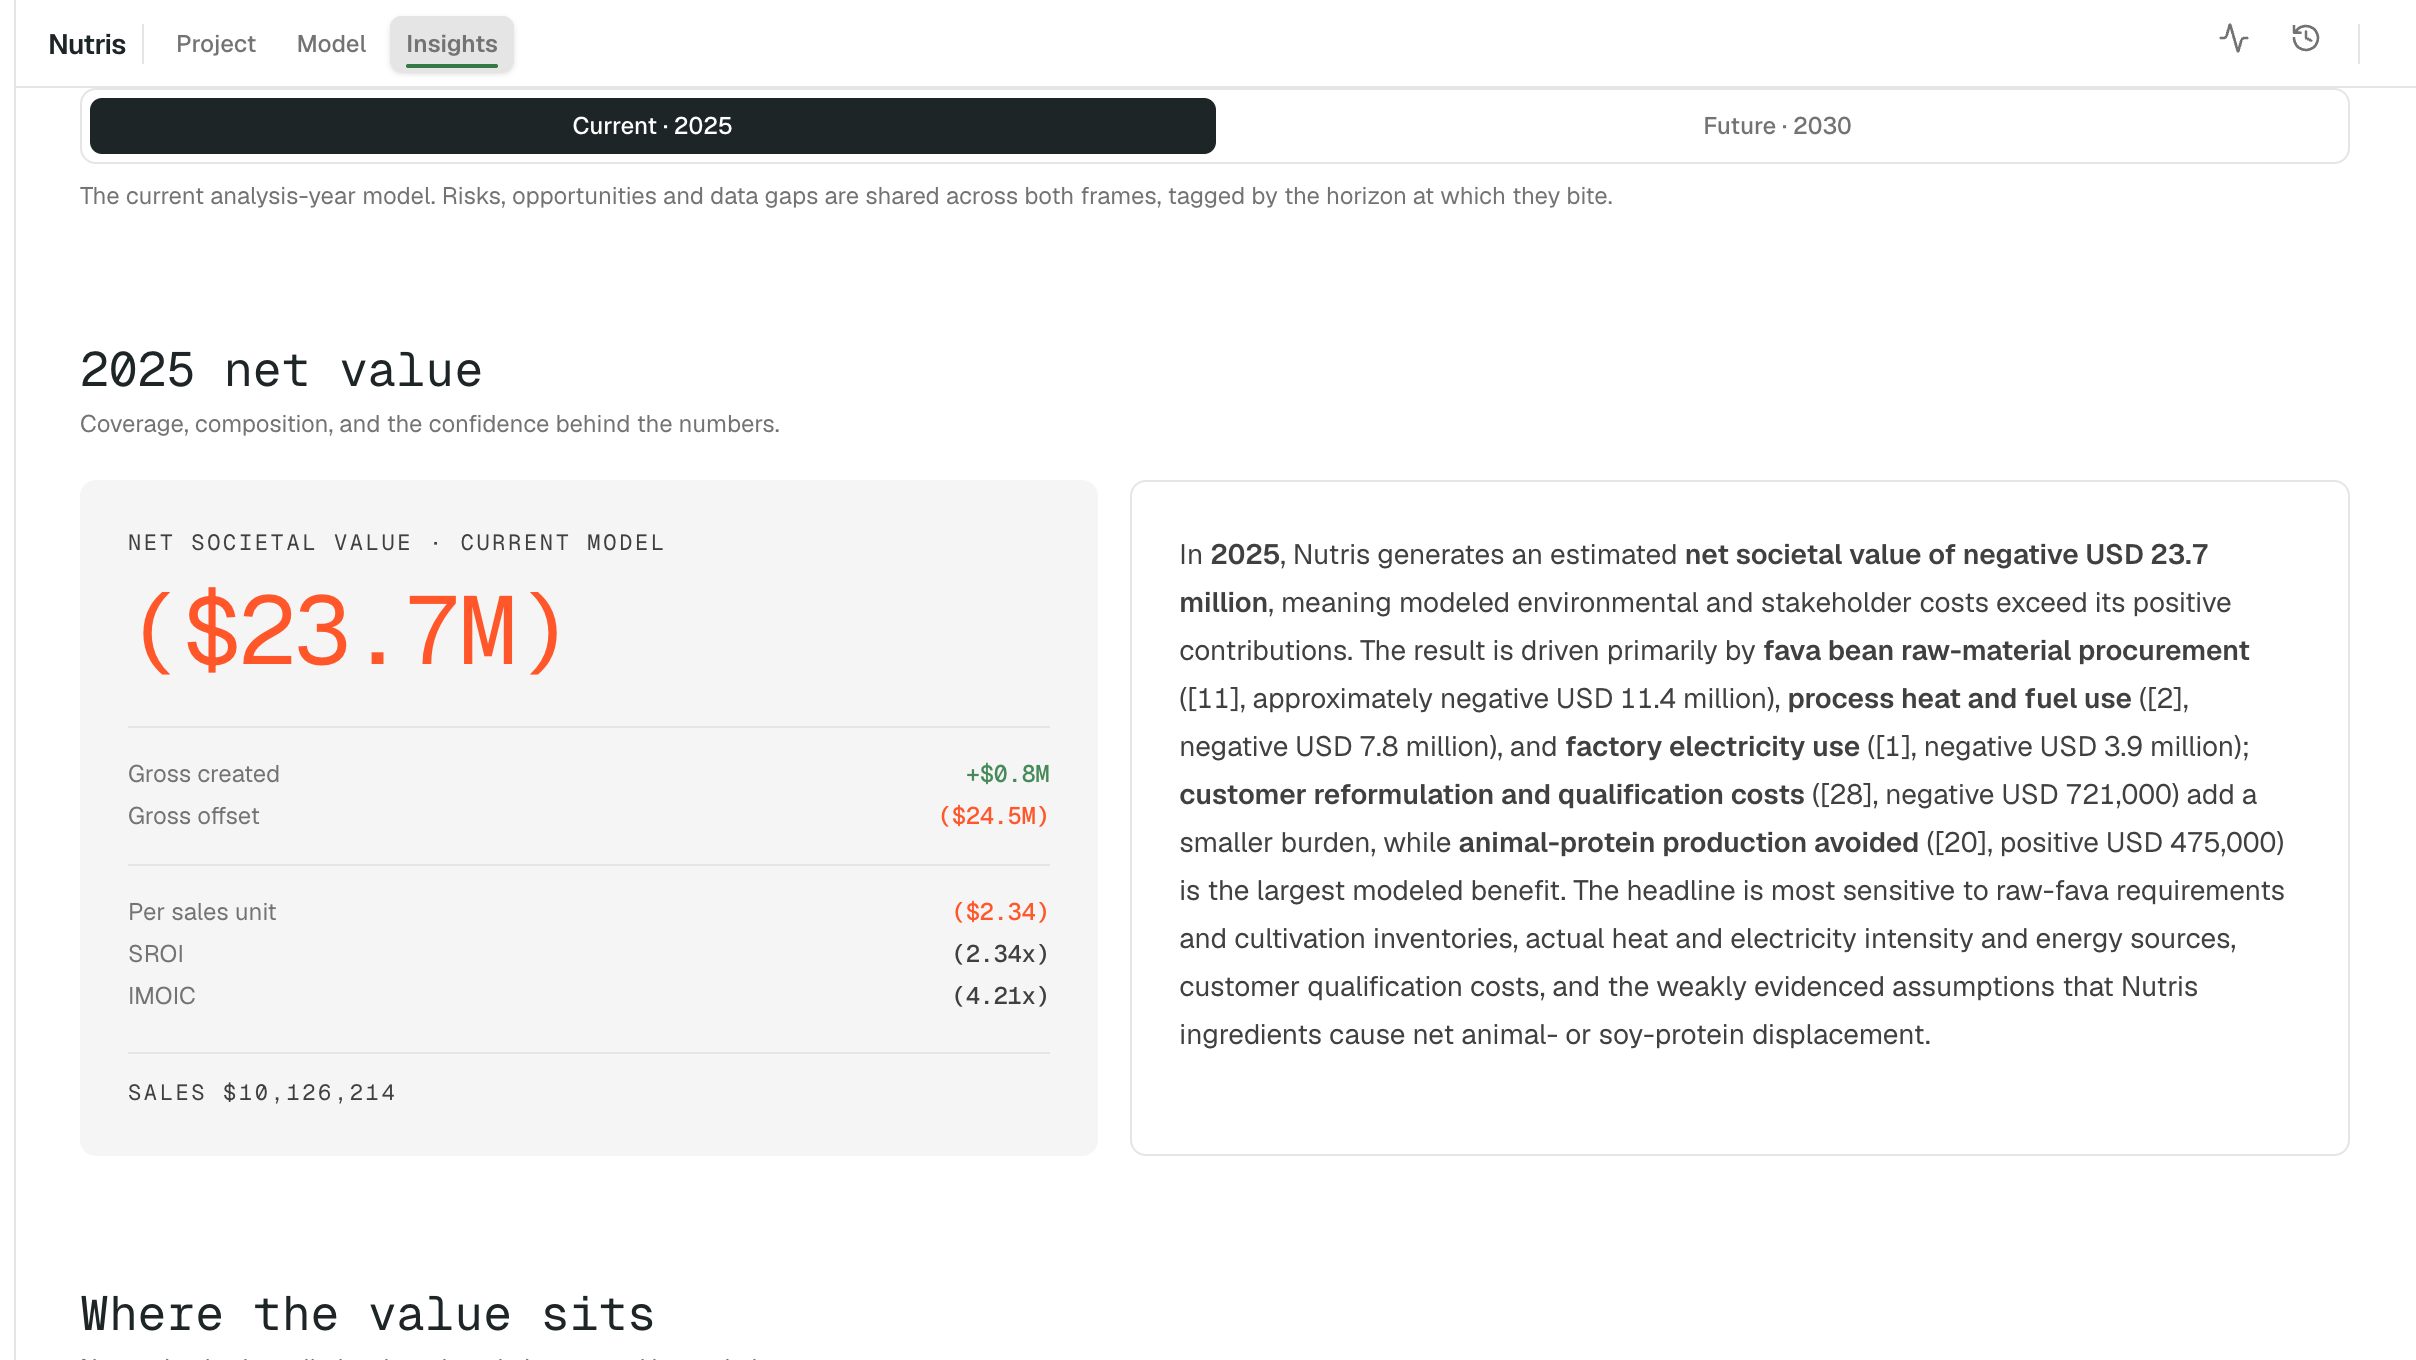
This pairs with the prediction scenarios introduced earlier in the summer. New analyses produce one accelerated growth scenario plus a comparison showing what happens if the identified risks or opportunities materialize, each with a written explanation of how the variant was built. For SFDR users, the reporting view now includes a future-value test, which matters when an Article 9 story is about trajectory rather than a snapshot.
💡 Try it in one minute: Open Insights on any project and flip between the current and future frames.
To model a specific alternative rather than the default trajectory, see Building scenarios.
Goal 4 · Put the financial case next to the societal one
The Financial Value module, built on the ROImpact Canvas method developed by Valuing Impact, adds a Business Value tab that maps your most material pathways to revenue, cost-saving and risk levers. Every mapping comes with an editable calculation you can review line by line, and the financial figures are kept strictly separate from the impact totals, never summed with them, because mixing the two is how impact numbers lose credibility.
In practice this is the tab that answers the question every CFO and investment committee eventually asks. Fine, but what does this impact mean for the business?
💡 Try it in one minute: Open the Business Value tab on your most material project and challenge one calculation.
Goal 5 · Answer "who benefits, and where?"
Insights can now break impact down by geography and by beneficiary group. The model chart shows read-only sub-pathway slices behind each pathway, and the same beneficiary detail reaches the pathway inspector and your Excel and workspace exports. For a portfolio spanning countries, this is the view that shows whether harm is concentrated in one sourcing geography or spread thin, and whether the value lands on the stakeholders your thesis says it should.
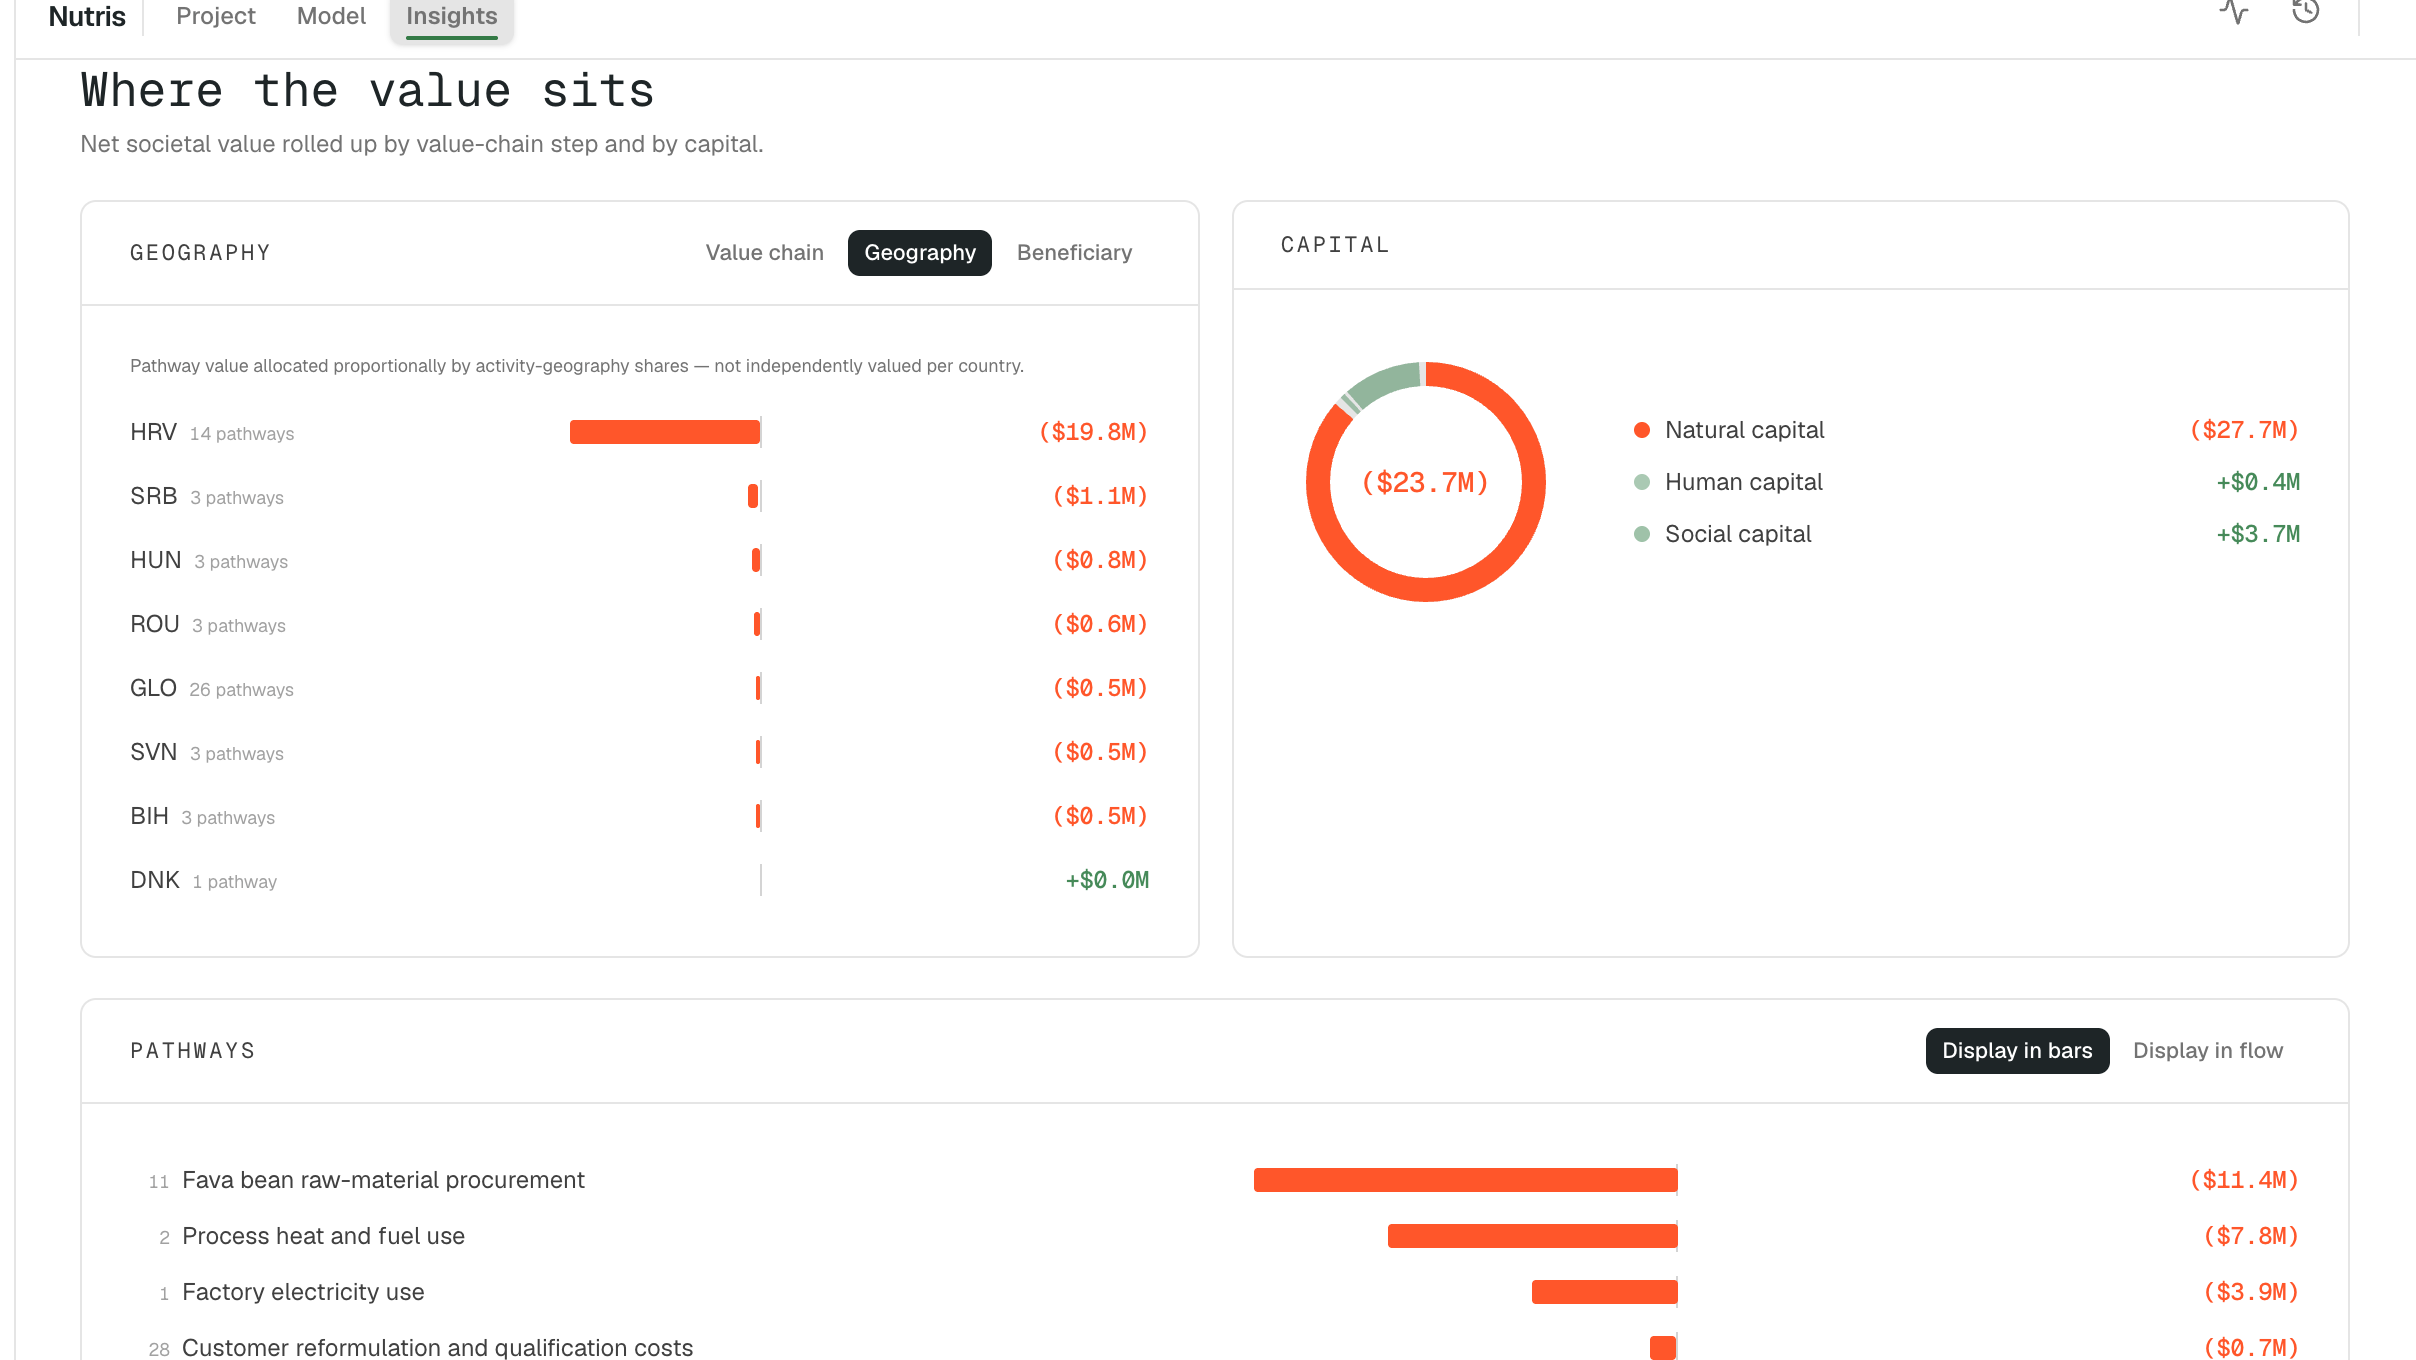
💡 Try it in one minute: On the Insights page, switch the value breakdown from value chain to geography.
Goal 6 · Trust every number down to the receipt
A quieter set of changes may matter most for anyone defending results in front of an auditor or a skeptical LP.
The pathway popup and inspector are now organised around the valuation formula, reading top to bottom like a receipt, with the ecoinvent decomposition available in the inspector. Chat gained ecoinvent tools too, so you can ask it to propose a decomposition for a pathway or search the ecoinvent catalog without leaving the conversation.
A round of accuracy fixes tightened how impacts are valued, with more consistent per-unit pricing, better handling of how long effects last, corrected biodiversity factors and safer health valuations. Currency is now traceable end to end. Variables show USD with conversion provenance and flip to native currency on demand, and exports carry the conversion with them.
💡 Try it in one minute: Open any pathway popup and read it like a receipt, then open the inspector for the decomposition.
Once you can read a number down to its evidence, the next habit is correcting it rather than starting over — see Calibrate, don't re-run.
Also shipped
Smaller changes that remove friction daily. Spreadsheets (.xlsx) can be uploaded as supporting documents and converted so the AI reads every sheet, while the original stays downloadable. The workspace sidebar can be reordered and archived per user. The two analysis setups now have clearer names, Organization mode for a whole organization and Project mode for a specific project, program or investment. The Variables panel gained filtering, the model view shows k/M/B units, the org profile split into quick-glance and detail tabs, and supporting documents are included in workspace ZIP exports.
What comes next
Four workstreams are in front of us, with no firm dates yet. Granularity is the biggest, bringing more detail across activities, pathways, geographies and beneficiary groups so a single analysis can carry hundreds of pathways rather than a handful. A design refresh will arrive gradually, with particular attention to how results are visualized. Skills will let you frame an assessment around the standardized methods and KPIs your organization already works with. And value factors published by the IVSB are being adapted so you can select the factor set you want, keeping the tool open to any set published in the future.
Book a session and put this to work
If you have an account and have not logged in since June, the fastest way to catch up is a coaching session. We go through your own projects, set up the new modules with you and show you what fits your work. Write to Samuel at sv@impactaccounting.ai, or log in and start with the one-minute tries above.
Not on the platform yet? Request access and test it on a name you know. And to get updates like this one as they ship, subscribe to the newsletter at the bottom of this page.
Appendix · The full changelog, March to August 2026
Everything that shipped, including the small and unglamorous items, one line each.
August 2026
- Current and future views on every project, switched directly on the Insights dashboard and labelled with real years; Insight Focus removed, horizon moved to advanced settings as Future Horizon
- Chat computes on your real project data, running calculations against a full project export with the production valuation engine, refreshed automatically after edits
- Portfolio chat, read-only analysis across every project in a workspace covering totals, comparisons, evidence and confidence
- Pathway popup reorganised as a formula receipt, with ecoinvent decomposition in the inspector
- Clearer analysis names, Organization mode and Project mode (formerly Initiative)
July 2026
- Rebuilt portfolio page, one page with quick-jump navigation, a single combined results table, a stronger benchmark and a simpler share dialog, mirrored on the public share page
- Arrangeable workspace sidebar with per-user ordering and archiving, and project or workspace creation from the search menu
- Excel uploads (.xlsx) as supporting documents, converted so the AI reads every sheet
- Geography and beneficiary breakdowns in Insights, with sub-pathway slices in the model chart and beneficiary detail in the inspector and exports
- Ecoinvent tools in chat, for decomposition proposals and catalog search
- More accurate impact calculations, with consistent per-unit pricing, better effect-duration handling, corrected biodiversity factors, safer health valuations and end-to-end currency traceability
- July refinements, including k/M/B units in the model view, Variables panel filtering, a two-tab org profile, compact numbers and a future-value test in the SFDR view, and supporting documents in ZIP exports
- Financial Value module (ROImpact), a Business Value tab mapping material pathways to revenue, cost-saving and risk levers with editable line-by-line calculations, kept separate from impact totals
- Focused prediction scenarios, one accelerated growth variant plus a risks-and-opportunities comparison, each with a written explanation
June 2026
- Workspace portfolio dashboard with impact totals, capital breakdowns, geography, benchmarking, forecast scenarios, risk signals, opportunities and data-quality issues
- Private portfolio share links with overview, companies, benchmark, risks and data tabs
- Regulatory reporting workbench with double materiality, CSRD/ESRS and SFDR & Article 9 views generated from the impact model
- CSRD evidence pack PDF export
- Project chat in a resizable sidebar, keeping model and insights context visible
- Simpler project navigation into Project, Model and Insights areas
- Model reasoning kept aligned with manual edits, and unit-aware initiative analysis for narrow boundaries
- Faster project loading for large projects
May 2026
- New Insights dashboard layout, a decision-ready summary with headline KPIs, animated pathway views, rollups, risks, opportunities and data challenges
- Editable org financials in a dedicated tab with supporting documents and a full audit trail
- Pathway inspector edit mode, manual pathway duplication and a dedicated validation review tab
- Project Statement page in a focused, print-friendly layout
- Better exchange rates using official yearly averages for 2020-2025, primarily from the IMF
- Clearer environmental cost breakdowns, clickable scenario bars, scenario data in workspace exports, and a required initiative scope before analysis
April 2026
- Renamed to ImpactAccounting.ai across product, navigation and brand assets
- Workspace exports as a ZIP with per-project Excel workbooks and machine-readable summaries
- Chat source tracing with citations, and citation usage tracking with links to the variables and pathways that reference each source
- Forward-looking Insights outlook based on the expected scenario
- Analysis intent field to tell the AI what question the valuation should answer
- Scale assessment of whether an initiative operates at its intended size
- Refined pathway details panel, baseline bars in scenario charts, compact chat layout, unified org summary, workspace member removal, smoother workspace startup
- Fixes for currency detection, prediction scaling, live formulas in Excel exports, citation merging and Safari dialogs
March 2026
- Redesigned analysis pipeline with up to 50 agents running in parallel, significantly faster and more accurate
- Editable scenarios with local-currency computation, automatic USD conversion and an optional reporting currency across 100+ currencies
- Citations panel and valuation timeline slider
- Revamped Insights page, guided onboarding and a pre-analysed demo project
- Pathway notes that travel with Excel exports, a redesigned Excel export UI with filtered options, and file uploads linked to credibility scoring
- Analysis year setting, inline editing and custom KPIs, and upgraded analysis agents across every stage